作者:书友73428983 | 来源:互联网 | 2023-06-04 18:20
根据事后在虚拟机中复现客户现场发生的情况,做一次记录(简化部分过程,原理不变)客户端1执行update语句SQLselect*fromtest;IDNAME2b10c1bSQL
根据事后在虚拟机中复现客户现场发生的情况,做一次记录(简化部分过程,原理不变)
客户端1执行update语句
SQL> select * from test;
ID NAME
---------- --------------------------------
2 b
10 c
1 b
SQL> update test set id = 3 where name = ‘c‘;
1 row updated.
客户端2执行另外一条update语句
SQL> update test set id = 4 where name = ‘c‘;
这个时候第二条update卡住了,证明发生了hanganalyze,查询当前的等待事件
SQL> select vw.sid,v.serial#, vw.event, vw.p1raw, vw.p2, v.username, sql_id from v$session_wait vw, v$session v where vw.sid = v.sid and vw.event not like ‘%message%‘ order by 3 desc;
SID SERIAL# EVENT P1RAW P2 USERNAME SQL_ID
---------- ---------- -------------------------------------------------- ---------------- ---------- --------------- -------------
13 1 smon timer 000000000000012C 0
2 1 pmon timer 000000000000012C 0
40 7 i/o slave wait 0000000091605340 0
42 23 i/o slave wait 0000000091605340 0
36 23 enq: TX - row lock contention 0000000054580006 196608 ELAN 53msja8m8hbcw
4 1 VKTM Logical Idle Wait 00 0
31 3 Streams AQ: waiting for time management or cleanup 00 0
tasks
18 15 Streams AQ: qmn slave idle wait 0000000000000001 0
25 9 Streams AQ: qmn coordinator idle wait 00 0
33 43 Space Manager: slave idle wait 00 0
8 1 DIAG idle wait 0000000000000005 1
6 1 DIAG idle wait 0000000000000005 1
12 rows selected.
可以看到等待事件中有tx锁
进而查找彼此发生的依赖关系,是谁堵塞了谁
SELECT DECODE(request,0,‘Holder: ‘,‘Waiter: ‘)||sid sess, id1, id2, lmode, request, type FROM V$LOCK WHERE (id1, id2, type) IN(SELECT id1, id2, type FROM V$LOCK WHERE request>0) ORDER BY id1, request;
SESS ID1 ID2 LMODE REQUEST TY
------------------------------------------------ ---------- ---------- ---------- ---------- --
Holder: 46 196608 786 6 0 TX
Waiter: 36 196608 786 0 6 TX
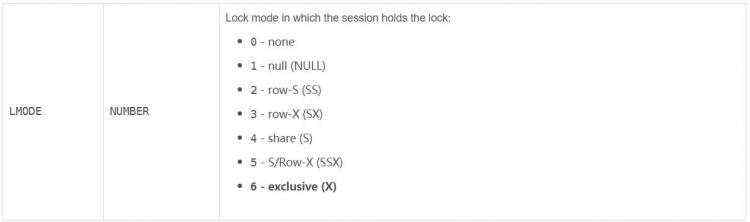
发现,持有者是46号sid,等待着是36号sid,并且lmode模式是6
在oracle官方的支持文档中可以看到对于该模式的描述 exclusive 独占(X):独立访问使用,exclusive,通常发生在Alter table, Drop table, Drop Index, Truncate table, Lock Exclusive
进而可以根据sid查找是那条语句发生了阻塞
SELECT /*+ ORDERED */ a.SQL_TEXT FROM v$sqltext a WHERE (a.hash_value, a.address) IN ( SELECT DECODE (sql_hash_value, 0, prev_hash_value, sql_hash_value ), DECODE (sql_hash_value, 0, prev_sql_addr, sql_address) FROM v$session b where b.SID = 46) order by a.PIECE
SQL_TEXT
----------------------------------------------------------------
update test set id = 3 where name = ‘c‘
进而可以根据sid和serial反查是那个机器发出了这条指令
select sid,serial#,machine,CLIENT_INFO from v$session where sid =
2 ‘46‘;
SID SERIAL# MACHINE CLIENT_INFO
---------- ---------- ---------------------------------------------------------------- ----------------------------------------------------------------
46 67 elan
基本就能够排查所出现情况,进而进行沟通解决,是不是语句未提交导致,或者是其他原因
等待持有锁的会话commit或者rollback。 通常为会话1在某行上执行 update/delete 未提交,会话2对同一行数据进行 update/delete,或其它原因(例如SQL性能差)造成的锁释放速度缓慢或网络问题,都会造成后续的会话进入队列等待
不着急查杀,这个还是要等待确认后,在进行下一步操作
接下里我们使用hanganalyze来分析上述问题
执行hanganalyze
SQL> ORADEBUG setmypid
Statement processed.
SQL> oradebug unlimit;
Statement processed.
SQL> oradebug hanganalyze 3
Hang Analysis in /u01/app/oracle/diag/rdbms/elan/elan/trace/elan_ora_6322.trc
SQL>
HANG ANALYSIS基本信息,摘录部分信息如下
-------------------------------------------------------------------------------
Chain 1:
-------------------------------------------------------------------------------
Oracle session identified by: --阻塞会话信息
{
instance: 1 (elan.elan)
os id: 6337
process id: 27, oracle@elan (TNS V1-V3)
session id: 36
session serial #: 23
}
is waiting for ‘enq: TX - row lock contention‘ with wait info:
{
p1: ‘name|mode‘=0x54580006
p2: ‘usn<<16 | slot‘=0x30000
p3: ‘sequence‘=0x312
time in wait: 19 min 57 sec
timeout after: never
wait id: 24
blocking: 0 sessions --此处显示当前会话没有阻塞的session,说明是被阻塞会话
current sql: update test set id = 4 where name = ‘c‘
wait history:
* time between current wait and wait #1: 0.000966 sec
1. event: ‘db file sequential read‘
time waited: 0.000178 sec
wait id: 23 p1: ‘file#‘=0x5
p2: ‘block#‘=0x8a
time waited: 0.000040 sec
wait id: 22 p1: ‘FileOperation‘=0x2
p2: ‘fileno‘=0x5
p3: ‘filetype‘=0x2
* time between wait #2 and #3: 0.001004 sec
3. event: ‘SQL*Net message from client‘
time waited: 17.589536 sec
wait id: 21 p1: ‘driver id‘=0x62657100
p2: ‘#bytes‘=0x1
}
and is blocked by
=> Oracle session identified by:
{
instance: 1 (elan.elan)
os id: 6336
process id: 25, oracle@elan (TNS V1-V3)
session id: 46 --会话session
session serial #: 67
}
which is waiting for ‘SQL*Net message from client‘ with wait info:
{
p1: ‘driver id‘=0x62657100
p2: ‘#bytes‘=0x1
time in wait: 20 min 21 sec
timeout after: never
wait id: 25
blocking: 1 session --此处显示被阻塞的会话数是1,也证明是锁会话持有者
current sql: <none>
short stack: ksedsts()+465<-ksdxfstk()+32<-ksdxcb()+1927<-sspuser()+112<-__sighandler()<-read()+14<-ntpfprd()+117<-nsbasic_brc()+376<-nsbrecv()+69<-nioqrc()+495<-opikndf2()+978<-opitsk()+831<-opiino()+969<-opiodr()+917<-opidrv()+570<-sou2o()+103<-opimai_real()+133<-ssthrdmain()+265<-main()+201<-__libc_start_main()+253
wait history:
* time between current wait and wait #1: 0.000003 sec
1. event: ‘SQL*Net message to client‘
time waited: 0.000001 sec
wait id: 24 p1: ‘driver id‘=0x62657100
p2: ‘#bytes‘=0x1
* time between wait #1 and #2: 0.000069 sec
2. event: ‘Disk file operations I/O‘
time waited: 0.000040 sec
wait id: 23 p1: ‘FileOperation‘=0x2
p2: ‘fileno‘=0x3
p3: ‘filetype‘=0x2
* time between wait #2 and #3: 0.000287 sec
通过上述分析:大概可以得出sid=36因为请求enq: TX - row lock contention(TX mode=6)被sid=46阻塞
分析过程基本如上


 京公网安备 11010802041100号