192.168.192.161-163 es集群 kibaba 9200 5601
192.168.192.164-166 zookerper+kafka集群 2181 2888 3888 +9092
192.168.192.167 logstash
k8s容器 filebeat

1,es部署
https://www.oracle.com/java/technologies/downloads/
https://www.elastic.co/cn/downloads/past-releases#elasticsearch
#系统日志
cat /var/log/syslog
cat /var/log/messages
#应用日志
error.log
accdesslog.log 访问统计分析
1,k8s运行daemonset,收集每一个node节点/var/lib/docker日志
优点:配置简单 缺点:日志不好分类
2,在每一个pod启动一个日志分析工具
filebeat 10多M内存,不需要java环境,推荐
logstash 几十M内存,需要java环境
dpkg -i elasticsearch-7.6.2-amd64.deb
vi /etc/elasticsearch/elasticsearch.yml
cluster.name: elk-cluster1
node.name: node-3
#bootstrap.memory_lock: true #/etc/elasticsearch/jvm.options
network.host: 192.168.192.161
http.port: 9200
discovery.seed_hosts: ["192.168.192.161", "192.168.192.162", "192.168.192.163"]
cluster.initial_master_nodes: ["192.168.192.161", "192.168.192.162", "192.168.192.163"]
gateway.recover_after_nodes: 2
action.destructive_requires_name: true
2,zookeeper部署
https://www.apache.org/dyn/closer.lua/zookeeper/zookeeper-3.5.9/apache-zookeeper-3.5.9-bin.tar.gz
apt install openjdk-8-jdk -y
root@ubuntu20:/apps/apache-zookeeper-3.5.9-bin/conf# cat zoo.cfg
tickTime=2000
initLimit=10
syncLimit=5
dataDir=/data/zookeeper
clientPort=2181
maxClientCnxns=128
autopurge.snapRetainCount=3
autopurge.purgeInterval=1
server.1=192.168.192.164:2888:3888
server.2=192.168.192.165:2888:3888
server.3=192.168.192.166:2888:3888
echo 1 > /data/zookeeper/myid
echo 2 > /data/zookeeper/myid
echo 3 > /data/zookeeper/myid
tickTime=2000
initLimit=10 20s内启动三台zookeeper
root@ubuntu20:/apps/apache-zookeeper-3.5.9-bin/bin# ./zkServer.sh status
/usr/bin/java
ZooKeeper JMX enabled by default
Using config: /apps/apache-zookeeper-3.5.9-bin/bin/../conf/zoo.cfg
Client port found: 2181. Client address: localhost. Client SSL: false.
Mode: leader
3,kafka部署
https://www.apache.org/dyn/closer.cgi?path=/kafka/3.0.0/kafka_2.13-2.4.1.tgz
root@ubuntu20:/apps/kafka_2.13-2.4.1/config# cat server.properties |grep -v "#" |grep -v "^$"
broker.id=2
listeners=PLAINTEXT://192.168.192.165:9092
num.network.threads=3
num.io.threads=8
socket.send.buffer.bytes=102400
socket.receive.buffer.bytes=102400
socket.request.max.bytes=104857600
log.dirs=/data/kafka-logs
num.partitions=1
num.recovery.threads.per.data.dir=1
offsets.topic.replication.factor=1
transaction.state.log.replication.factor=1
transaction.state.log.min.isr=1
log.retention.hours=168
log.segment.bytes=1073741824
log.retention.check.interval.ms=300000
zookeeper.connect=192.168.192.164:2181,192.168.192.165:2181,192.168.192.166:2181
zookeeper.connection.timeout.ms=6000
group.initial.rebalance.delay.ms=0
存储路径 log.dirs=/data/kafka-logs
root@ubuntu20:/data/kafka-logs# ls
__consumer_offsets-0 __consumer_offsets-16 __consumer_offsets-22 __consumer_offsets-30 __consumer_offsets-38 __consumer_offsets-44 __consumer_offsets-8 recovery-point-offset-checkpoint
__consumer_offsets-10 __consumer_offsets-18 __consumer_offsets-24 __consumer_offsets-32 __consumer_offsets-4 __consumer_offsets-46 cleaner-offset-checkpoint replication-offset-checkpoint
__consumer_offsets-12 __consumer_offsets-2 __consumer_offsets-26 __consumer_offsets-34 __consumer_offsets-40 __consumer_offsets-48 log-start-offset-checkpoint topic-test1-1
__consumer_offsets-14 __consumer_offsets-20 __consumer_offsets-28 __consumer_offsets-36 __consumer_offsets-42 __consumer_offsets-6 meta.properties topic-test1-2
root@ubuntu20:/data/kafka-logs# ls topic-test1-1/
00000000000000000000.index 00000000000000000000.log 00000000000000000000.timeindex leader-epoch-checkpoint
root@ubuntu20:/data/kafka-logs# ls __consumer_offsets-10/
00000000000000000000.index 00000000000000000000.log 00000000000000000000.timeindex leader-epoch-checkpoint
root@ubuntu20:/apps/kafka_2.13-2.4.1/config# vi server.propertie
broker.id=1 2 3
listeners=PLAINTEXT://192.168.192.164 5 6:9092
#num.network.threads=3
#num.io.threads=8
log.dirs=/data/kafka-logs
zookeeper.connect=192.168.192.164:2181,192.168.192.165:2181,192.168.192.166:2181
/apps/kafka/bin/kafka-server-start.sh -daemon /apps/kafka/config/server.properties
LISTEN 0 50 [::ffff:192.168.192.165]:9092 *:*
https://www.elastic.co/guide/en/beats/filebeat/7.6/kafka-output.html
root@slave002:/opt/k8s-data/dockerfile/web/chuan/tomcat-app1# cat run_tomcat.sh
/usr/share/filebeat/bin/filebeat -e -c /etc/filebeat/filebeat.yml -path.home /usr/share/filebeat -path.config /etc/filebeat -path.data /var/lib/filebeat -path.logs /var/log/filebeat &
su - nginx -c "/apps/tomcat/bin/catalina.sh start"
tail -f /etc/hosts
在topic-test下创建3个分区,将任意一个分区复制到两个broker上,如果一个broker挂了,还可以从另一个broker上获取消息
./kafka-topics.sh --create --zookeeper 192.168.192.164:2181 --topic topic-test1 --replication-factor 2 --partitions 3
./kafka-topics.sh --list --zookeeper 192.168.192.164:2181
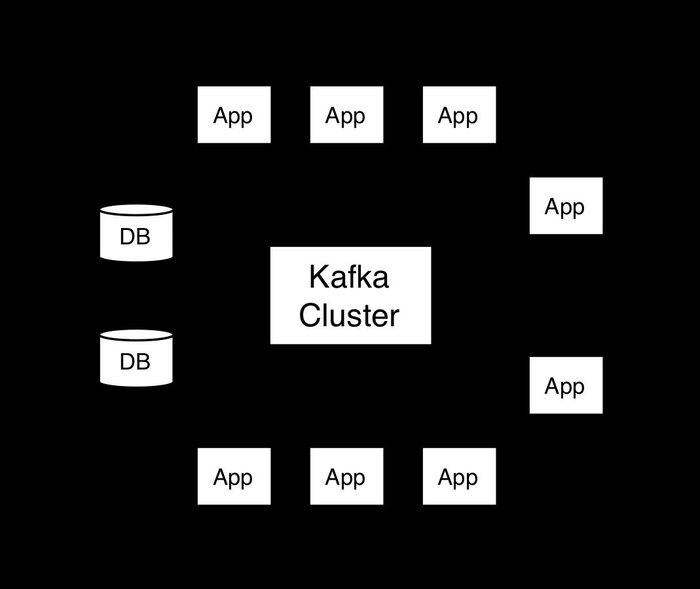
#kafka架构
broker:一台kafka服务器就是一个broker,一个集群由多个broker组成,一个broker可以容纳多个topic.
topic: 可以理解为一个队列,生产者和消费者面向的都是一个topic 类似数据库的表名或者ES的index 物理上不同topic的消息可以分开存储.
partion: 为了实现可拓展性,一个非常大的topic可以分布到多个broker(即服务器)上,一个topic可以分割为一个或多个partition,每个partitions是一个有序的队列。kafka只保证partition内的记录是有序的,而不保证
topic中不同partion的顺序。 每个topic至少有一个partition,当生产者产生数据的时候,会根据分配策略选择分区,然后将消息追加到指定的分区的队列末尾。
分区原因:方便在集群中拓展,每个partition可以通过调整适应所在的机器,一个topic可以有多个partition组成,一次整个集群就可以适应任意大小的数据了
可以提高并发,因为可以以partition为单位读写了。
4,制作tomcat+filebeat镜像
[root@chuan-tomcat-app1-deployment-5cb9f7bf6b-q6gr5 filebeat]# cat filebeat.yml
filebeat.inputs:
- type: log
enabled: true
paths:
- /apps/tomcat/logs/catalina.out
fields:
type: tomcat-catalina
- type: log
enabled: true
paths:
- /apps/tomcat/logs/localhost_access_log.*.txt
fields:
type: tomcat-accesslog
filebeat.config.modules:
path: ${path.config}/modules.d/*.yml
reload.enabled: false
setup.template.settings:
index.number_of_shards: 1
setup.kibana:
output.kafka:
hosts: ["192.168.192.164:9092"]
required_acks: 1
compression: gzip
max_message_bytes: 1000000
topic: "topic-test1"
#output.redis:
# hosts: ["192.168.192.152:36379"]
# key: "k8s-chuan-app1"
# db: 1
# timeout: 5
# password: "123456"
[root@chuan-tomcat-app1-deployment-5cb9f7bf6b-q6gr5 filebeat]# ps -ef|grep filebeat
root 143 83 0 14:19 pts/0 00:00:00 /usr/share/filebeat/bin/filebeat -e -c /etc/filebeat/filebeat.yml -path.home /usr/share/filebeat -path.config /etc/filebeat -path.data /var/lib/filebeat -path.logs /var/log/filebeat
root 179 153 0 14:23 pts/1 00:00:00 grep --color=auto filebeat
https://www.kafkatool.com/download.html

5,logstash部署
文档 https://www.elastic.co/guide/en/logstash/7.6/plugins-inputs-kafka.html
1,安装jdk
2,dpkg -i logstash-7.6.2.deb
/usr/share/logstash/bin/logstash -f kafka-to-es.conf -t
Config Validation Result: OK
/usr/share/logstash/bin/logstash -f kafka-to-es.conf
root@ubuntu20:/etc/logstash/conf.d# cat kafka-to-es.conf
input {
kafka {
bootstrap_servers => "192.168.192.164:9092,:9092,192.168.192.165:9092"
topics => ["topic-test1"]
codec => "json"
}
}
output {
if [fields][type] == "tomcat-accesslog" {
elasticsearch {
hosts => ["192.168.192.161:9200","192.168.192.162:9200"]
index => "chuan-accesslog-%{+YYYY.MM.dd}"
}
}
if [fields][type] == "tomcat-catalina" {
elasticsearch {
hosts => ["192.168.192.161:9200","192.168.192.162:9200"]
index => "chuan-catalinalog-%{+YYYY.MM.dd}"
}
}
stdout {
codec => rubydebug
}
}
6,kibana部署
dpkg -i kibana-7.6.2-amd64.deb
vi /etc/kibana/kibana.yml
server.port: 5601
server.host: "192.168.192.161"
elasticsearch.hosts: ["http://192.168.192.161:9200"]
i18n.locale: "zh-CN"
root@ubuntu20:~# ss -tnl|grep 5601
LISTEN 0 511 192.168.192.161:5601 0.0.0.0:*


原文链接:https://www.cnblogs.com/gxc888/p/15468543.html


 京公网安备 11010802041100号 | 京ICP备19059560号-4 | PHP1.CN 第一PHP社区 版权所有