canvas应用例子-思维导图
效果图如下: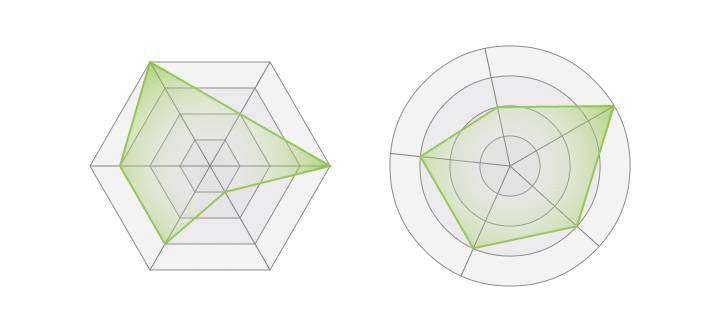
函数说明:
// 求圆上一点坐标,返回坐标点
function circlePoint(x, y, r, a) {var tmpx = x + r * Math.cos(a * Math.PI / 180);var tmpy = y + r * Math.sin(a * Math.PI / 180);return {x: tmpx,y: tmpy}
}
//画正多边形
function polygon(context,x, y, n, r) {context.beginPath();context.fillStyle = "rgba(215,216,217,.3)"; context.strokeStyle = "hsl(210,0%,50%)"; context.lineWidth = 1; for(var i=0;i
}
//画圆形
function circle(context,x,y,n,r){context.beginPath();context.arc(x, y, r, 0, Math.PI * 2, true);context.strokeStyle = "hsl(210,0%,50%)";context.fillStyle = "rgba(215,216,217,.3)";context.lineWidth = 1; context.stroke();context.fill();
}
// x坐标
// y坐标
// rnum 正多变行的边的个数, 至少为3个,否则为圆形
// cnum 同心图形个数
// radnum 圆形放射条数,只有圆形起作用
// R 最大半径
// rot 旋转角度
// arr 交点,交点个数与正多边形边数相同或与圆形放射条数相同
function drawGraph(ctx,x,y,rnum,cnum,radnum,R,rot,arr){var isCircle &#61; rnum<3?true:false;var tmpNum &#61; 0;if(isCircle){tmpNum &#61; radnum;} else{tmpNum &#61; rnum;}for(var i &#61;0;i
}}for (var i &#61; 0; i
}
//使用方法
drawGraph(ctx,150,200,6,4,0,120,0,[1, 0.25, 0.75, 0.75, 1,0.5]);
drawGraph(ctx,450,200,0,4,5,120,-30,[1, 0.75, 0.75, 0.75, 0.5]);
例子&#xff1a;demo
参考&#xff1a;
https://developer.mozilla.org/zh-CN/docs/Web/Guide/HTML/Canvas_tutorial
http://www.w3schools.com/html/html5_canvas.asp


 京公网安备 11010802041100号