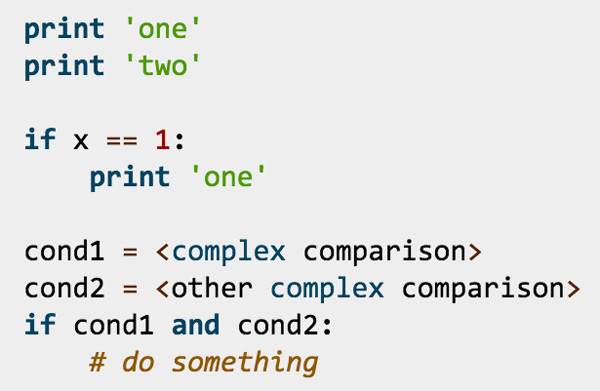
我正在玩这个答案的代码,稍微修改一下:
BITS 64

GLOBAL _start

SECTION .text

_start:
 mov ecx, 1000000

.loop:

 ;T is a symbol defined with the CLI (-DT=...)

 TIMES T imul eax, eax
 lfence
 TIMES T imul edx, edx


 dec ecx
jnz .loop

 mov eax, 60           ;sys_exit
 xor edi, edi
 syscall
没有lfence我,我得到的结果与答案中的静态分析一致.
当我介绍一个单一 lfence我期望的CPU执行imul edx, edx的序列的第k个平行于迭代imul eax, eax的下一个(的序列K + 1个)迭代.
像这样的东西(调用一个的imul eax, eax序列和d的imul edx, edx一个):
|
| A
| D A
| D A
| D A
| ...
| D A
| D
|
V time
采用或多或少相同数量的周期,但是对于一个不成对的并行执行.
当我测量周期的数量,原始和修改后的版本,以taskset -c 2 ocperf.py stat -r 5 -e cycles:u '-x ' ./main-$T用于T在以下范围内,我得到
T   Cycles:u    Cycles:u    Delta
    lfence      no lfence

10  42047564    30039060    12008504
15  58561018    45058832    13502186
20  75096403    60078056    15018347
25  91397069    75116661    16280408
30  108032041   90103844    17928197
35  124663013   105155678   19507335
40  140145764   120146110   19999654
45  156721111   135158434   21562677
50  172001996   150181473   21820523
55  191229173   165196260   26032913
60  221881438   180170249   41711189
65  250983063   195306576   55676487
70  281102683   210255704   70846979
75  312319626   225314892   87004734
80  339836648   240320162   99516486
85  372344426   255358484   116985942
90  401630332   270320076   131310256
95  431465386   285955731   145509655
100 460786274   305050719   155735555

如何Cycles:u lfence解释这些价值?
我希望它们与那些相似,Cycles:u no lfence因为单个lfence应该只阻止第一次迭代并行执行两个块.
我不认为这是由于lfence开销,因为我认为应该对所有人保持不变T.
在处理代码的静态分析时,我想解决我的形式问题.
支持带有源文件的存储库.
I think you're measuring accurately, and the explanation is microarchitectural, not any kind of measurement error.
I think your results for mid to low T support the conclusion that lfence stops the front-end from even issuing past the lfence until all earlier instructions retire, rather than having all the uops from both chains already issued and just waiting for lfence to flip a switch and let multiplies from each chain start to dispatch on alternating cycles.
(port1 would get edx,eax,empty,edx,eax,empty,... for Skylake's 3c latency/1c throughput multiplier right away, if lfence didn't block the front-end, and overhead wouldn't scale with T.)
imul当只有来自第一个链的uops在调度程序中时,你会失去吞吐量,因为前端还没有通过imul edx,edxand loop分支进行咀嚼.并且对于窗口末端的相同循环次数,当管道大部分被排空并且仅剩下来自第二链的uops时.
开销增量看起来是线性的,约为T = 60.我没有运行数字,但是到那里的斜率看起来合理的T * 0.25时钟发出第一链和3c延迟执行瓶颈.即delta增长速度可能是总无噪声周期的1/12.
所以(考虑到lfence我在下面测量的开销),T <60:
no_lfence cycles/iter ~= 3T                  # OoO exec finds all the parallelism
lfence    cycles/iter ~= 3T + T/4 + 9.3      # lfence constant + front-end delay
                delta ~=      T/4 + 9.3
@Margaret reports that T/4 is a better fit than 2*T / 4, but I would have expected T/4 at both the start and end, for a total of 2T/4 slope of the delta.
After about T=60, delta grows much more quickly (but still linearly), with a slope about equal to the total no-lfence cycles, thus about 3c per T. I think at that point, the scheduler (Reservation Station) size is limiting the out-of-order window. You probably tested on a Haswell or Sandybridge/IvyBridge, (which have a 60-entry or 54-entry scheduler respectively. Skylake's is 97 entry.
The RS tracks un-executed uops. Each RS entry holds 1 unfused-domain uop that's waiting for its inputs to be ready, and its execution port, before it can dispatch and leave the RS1.
在a之后lfence,前端以每时钟4个发出,而后端以每3个时钟1个为单位执行,在~15个周期内发出60个uop,在此期间,链中只有5个imul指令edx被执行.(这里没有加载或存储微融合,因此来自前端的每个融合域uop在RS 2中仍然只有1个未融合域uop .)
对于大T,RS快速填满,此时前端只能以后端的速度进行.(对于小T,我们lfence在发生之前就进行了下一次迭代,这就是前端的停滞). 当T> RS_size时,后端无法看到来自eaximul链的任何uop,直到通过edx链的足够的后端进度在RS中腾出空间.此时,imul每个链中的一个可以每3个周期发送一次,而不仅仅是第一个或第二个链.
请记住,从第一部分开始,只在lfence执行第一个链之后花费的时间=仅在lfence执行第二个链之前的时间.这也适用于此.
We get some of this effect even with no lfence, for T > RS_size, but there's opportunity for overlap on both sides of a long chain. The ROB is at least twice the size of the RS, so the out-of-order window when not stalled by lfence should be able to keep both chains in flight constantly even when T is somewhat larger than the scheduler capacity. (Remember that uops leave the RS as soon as they've executed. I'm not sure if that means they have to finish executing and forward their result, or merely start executing, but that's a minor difference here for short ALU instructions. Once they're done, only the ROB is holding onto them until they retire, in program order.)
ROB和寄存器文件不应该在这种假设情况下或在您的实际情况下限制无序窗口大小(http://blog.stuffedcow.net/2013/05/measuring-rob-capacity/)情况.它们应该都很大.
阻止前端是lfence英特尔搜索的实现细节.该手册仅表示后续指令无法执行.lfence只要没有人被分派到执行单元,该措辞将允许前端将它们全部发布/重命名为调度程序(Reservation Station)和ROB,同时仍在等待.
所以较弱的lfence可能会有平坦的开销直到T = RS_size,然后是你现在看到的T> 60的相同斜率. (并且开销的不变部分可能会更低.)
请注意,在lfence应用于执行后,保证有关条件/间接分支的推测执行,而不是(据我所知)代码获取.仅仅触发代码获取(AFAIK)对于Spectre或Meltdown攻击并非有用.可能是一个定时侧通道来检测它的解码方式可能会告诉你有关所提取代码的信息......
我认为当相关的MSR启用时,AMD的LFENCE至少与实际的AMD CPU一样强.(LFENCE是否在AMD处理器上进行序列化?).
lfence开销:你的结果很有意思,但它本身并不让我感到惊讶,因为它lfence本身(对于小T)以及与T一起扩展的组件有显着的恒定开销.
请记住,lfence在先前的指令退役之前,不允许以后的指令启动.这可能至少比他们的结果准备好绕过前往其他执行单元(即正常延迟)的时候至少有几个周期/流水线阶段.
因此对于小T来说,通过要求结果不仅准备就绪,而且还要写回寄存器文件,您必须在链中添加额外的延迟,这一点非常重要.
It probably takes an extra cycle or so for lfence to allow the issue/rename stage to start operating again after detecting retirement of the last instruction before it. The issue/rename process takes multiple stages (cycles), and maybe lfence blocks at the start of this, instead of in the very last step before uops are added into the OoO part of the core.
Even back-to-back lfence itself has 4 cycle throughput on SnB-family, according to Agner Fog's testing. Agner Fog reports 2 fused-domain uops (no unfused), but on Skylake I measure it at 6 fused-domain (still no unfused) if I only have 1 lfence. But with more lfence back-to-back, it's fewer uops! Down to ~2 uops per lfence with many back-to-back, which is how Agner measures.
lfence/dec/jnz (a tight loop with no work) runs at 1 iteration per ~10 cycles on SKL, so that might give us an idea of the real extra latency that lfence adds to the dep chains even without the front-end and RS-full bottlenecks.
Measuring lfence overhead with only one dep chain, OoO exec being irrelevant:
.loop:
    ;mfence                  ; mfence here:  ~62.3c (with no lfence)
    lfence                   ; lfence here:  ~39.3c
    times 10 imul eax,eax    ; with no lfence: 30.0c
    ; lfence                 ; lfence here:  ~39.6c
    dec   ecx
    jnz   .loop
Without lfence, runs at the expected 30.0c per iter. With lfence, runs at ~39.3c per iter, so lfence effectively added ~9.3c of "extra latency" to the critical path dep chain. (And 6 extra fused-domain uops).
With lfence after the imul chain, right before the loop-branch, it's slightly slower. But not a whole cycle slower, so that would indicate that the front-end is issuing the loop-branch + and imul in a single issue-group after lfence allows execution to resume. That being the case, IDK why it's slower. It's not from branch misses.
Interleave the chains in program order, like @BeeOnRope suggests in comments, doesn't require out-of-order execution to exploit the ILP, so it's pretty trivial:
.loop:
    lfence      ; at the top of the loop is the lowest-overhead place.

%rep T
    imul   eax,eax
    imul   edx,edx
%endrep

    dec     ecx
    jnz    .loop
You could put pairs of short times 8 imul chains inside a %rep to let OoO exec have an easy time.
My mental model is that the issue/rename/allocate stages in the front-end add new uops to both the RS and the ROB at the same time.
Uops leave the RS after executing, but stay in the ROB until in-order retirement. The ROB can be large because it's never scanned out-of-order to find the first-ready uop, only scanned in-order to check if the oldest uop(s) have finished executing and thus are ready to retire.
(I assume the ROB is physically a circular buffer with start/end indices, not a queue which actually copies uops to the right every cycle. But just think of it as a queue/list with a fixed max size, where the front-end adds uops at the front, and the retirement logic retires/commits uops from the end as long as they're fully executed, up to some per-cycle per-hyperthread retirement limit which is not usually a bottleneck. Skylake did increase it for better Hyperthreading, maybe to 8 per clock per logical thread. Perhaps retirement also means freeing physical registers which helps HT, because the ROB itself is statically partitioned when both threads are active. That's why retirement limits are per logical thread.)
Uops like nop, xor eax,eax, or lfence, which are handled in the front-end (don't need any execution units on any ports) are added only to the ROB, in an already-executed state. (A ROB entry presumably has a bit that marks it as ready to retire vs. still waiting for execution to complete. This is the state I'm talking about. For uops that did need an execution port, I assume the ROB bit is set via a completion port from the execution unit. And that the same completion-port signal frees its RS entry.)
Uops stay in the ROB from issue to retirement.
Uops stay in the RS from issue to execution. The RS can replay uops in a few cases, e.g. for the other half of a cache-line-split load, or if it was dispatched in anticipation of load data arriving, but in fact it didn't. (Cache miss or other conflicts like Weird performance effects from nearby dependent stores in a pointer-chasing loop on IvyBridge. Adding an extra load speeds it up?.) Or when a load port speculates that it can bypass the AGU before starting a TLB lookup to shorten pointer-chasing latency with small offsets - Is there a penalty when base+offset is in a different page than the base?
So we know that the RS can't remove a uop right as it dispatches, because it might need to be replayed. (Can happen even to non-load uops that consume load data.) But any speculation that needs replays is short-range, not through a chain of uops, so once a result comes out the other end of an execution unit, the uop can be removed from the RS. Probably this is part of what a completion port does, along with putting the result on the bypass forwarding network.
TL:DR: P6-family: RS is fused, SnB-family: RS is unfused.
A micro-fused uop is issued to two separate RS entries in Sandybridge-family, but only 1 ROB entry. (Assuming it isn't un-laminated before issue, see section 2.3.5 for HSW or section 2.4.2.4 for SnB of Intel's optimization manual, and Micro fusion and addressing modes. Sandybridge-family's more compact uop format can't represent indexed addressing modes in the ROB in all cases.)
The load can dispatch independently, ahead of the other operand for the ALU uop being ready. (Or for micro-fused stores, either of the store-address or store-data uops can dispatch when its input is ready, without waiting for both.)
I used the two-dep-chain method from the question to experimentally test this on Skylake (RS size = 97), with micro-fused or edi, [rdi] vs. mov+or, and another dep chain in rsi. (Full test code, NASM syntax on Godbolt)
; loop body
%rep T
%if FUSE
    or edi, [rdi]    ; static buffers are in the low 32 bits of address space, in non-PIE
%else
    mov  eax, [rdi]
    or   edi, eax
%endif
%endrep

%rep T
%if FUSE
    or esi, [rsi]
%else
    mov  eax, [rsi]
    or   esi, eax
%endif
%endrep
Looking at uops_executed.thread (unfused-domain) per cycle (or per second which perf calculates for us), we can see a throughput number that doesn't depend on separate vs. folded loads.
With small T (T=30), all the ILP can be exploited, and we get ~0.67 uops per clock with or without micro-fusion. (I'm ignoring the small bias of 1 extra uop per loop iteration from dec/jnz. It's negligible compared to the effect we'd see if micro-fused uops only used 1 RS entry)
Remember that load+or is 2 uops, and we have 2 dep chains in flight, so this is 4/6, because or edi, [rdi] has 6 cycle latency. (Not 5, which is surprising, see below.)
At T=60, we still have about 0.66 unfused uops executed per clock for FUSE=0, and 0.64 for FUSE=1. We can still find basically all the ILP, but it's just barely starting to dip, as the two dep chains are 120 uops long (vs. a RS size of 97).
At T=120, we have 0.45 unfused uops per clock for FUSE=0, and 0.44 for FUSE=1. We're definitely past the knee here, but still finding some of the ILP.
If a micro-fused uop took only 1 RS entry, FUSE=1 T=120 should be about the same speed as FUSE=0 T=60, but that's not the case. Instead, FUSE=0 or 1 makes nearly no difference at any T. (Including larger ones like T=200: FUSE=0: 0.395 uops/clock, FUSE=1: 0.391 uops/clock). We'd have to go to very large T before we start for the time with 1 dep-chain in flight to totally dominate the time with 2 in flight, and get down to 0.33 uops/clock (2/6).
Oddity: We have such a small but still measurable difference in throughput for fused vs. unfused, with separate mov loads being faster.
Other oddities: the total uops_executed.thread is slightly lower for FUSE=0 at any given T. Like 2,418,826,591 vs. 2,419,020,155 for T=60. This difference was repeatable down to +- 60k out of 2.4G, plenty precise enough. FUSE=1 is slower in total clock cycles, but most of the difference comes from lower uops per clock, not from more uops.
Simple addressing modes like [rdi] are supposed to only have 4 cycle latency, so load + ALU should be only 5 cycle. But I measure 6 cycle latency for the load-use latency of or rdi, [rdi], or with a separate MOV-load, or with any other ALU instruction I can never get the load part to be 4c.
A complex addressing mode like [rdi + rbx + 2064] has the same latency when there's an ALU instruction in the dep chain, so it appears that Intel's 4c latency for simple addressing modes only applies when a load is forwarding to the base register of another load (with up to a +0..2047 displacement and no index).
Pointer-chasing is common enough that this is a useful optimization, but we need to think of it as a special load-load forwarding fast-path, not as a general data ready sooner for use by ALU instructions.
P6-family is different: an RS entry holds a fused-domain uop.
@Hadi found an Intel patent from 2002, where Figure 12 shows the RS in the fused domain.
Experimental testing on a Conroe (first gen Core2Duo, E6600) shows that there's a large difference between FUSE=0 and FUSE=1 for T=50. (The RS size is 32 entries).
T=50 FUSE=1: total time of 2.346G cycles (0.44IPC)
T=50 FUSE=0: total time of 3.272G cycles (0.62IPC = 0.31 load+OR per clock). (perf/ocperf.py doesn't have events for uops_executed on uarches before Nehalem or so, and I don't have oprofile installed on that machine.)
T=24 there's a negligible difference between FUSE=0 and FUSE=1, around 0.47 IPC vs 0.9 IPC (~0.45 load+OR per clock).
T=24 is still over 96 bytes of code in the loop, too big for Core 2's 64-byte (pre-decode) loop buffer, so it's not faster because of fitting in a loop buffer. Without a uop-cache, we have to be worried about the front-end, but I think we're fine because I'm exclusively using 2-byte single-uop instructions that should easily decode at 4 fused-domain uops per clock.


 京公网安备 11010802041100号 | 京ICP备19059560号-4 | PHP1.CN 第一PHP社区 版权所有