热门标签 | HotTags
当前位置:  开发笔记 > 开发工具 > 正文

gnuplotlearnnote

gnuplotlearnnote设置terminal类型setterminalwxtwxtterminal弹出新的窗口,绘制2D图像Thewxtterminaldevicegene

gnuplot learn note

设置terminal类型


set terminal wxt

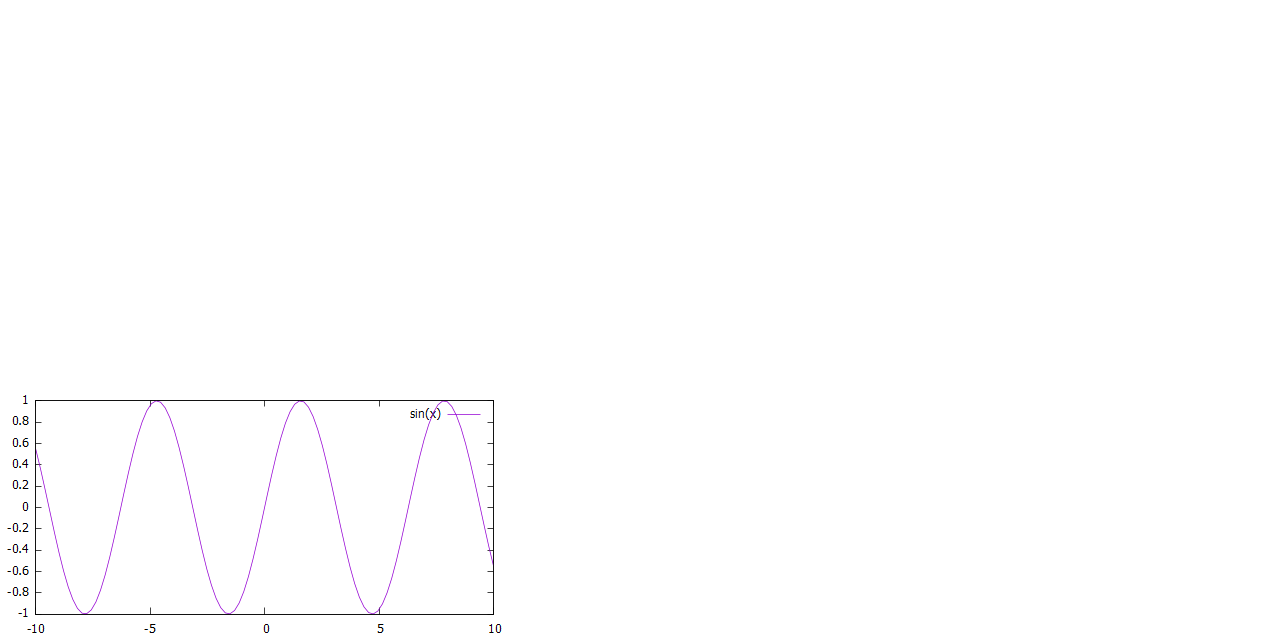
wxt terminal弹出新的窗口,绘制2D图像

The wxt terminal device generates output in a separate window. The window is created by the wxWidgets library, where the 'wxt' comes from. The actual drawing is done via cairo, a 2D graphics library, and pango, a library for laying out and rendering text.
Syntax:
set term wxt {}
{size ,} {position ,}
{background | nobackground}
{{no}enhanced}
{font } {fontscale }
{title "title"}
{linewidth } {butt|rounded|square}
{dashlength

}
{{no}persist}
{{no}raise}
{{no}ctrl}
{close}

set terminal dumb

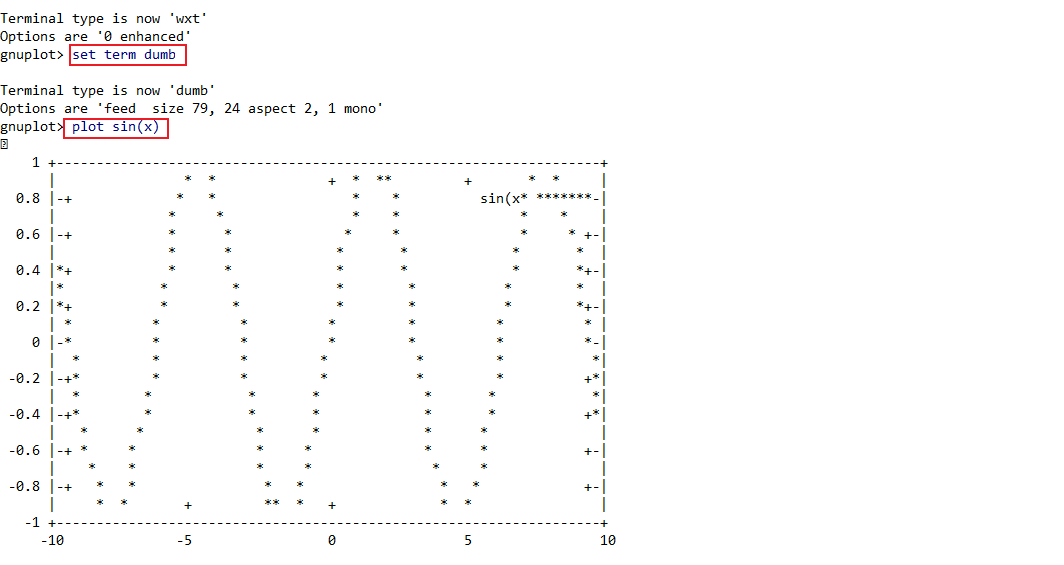
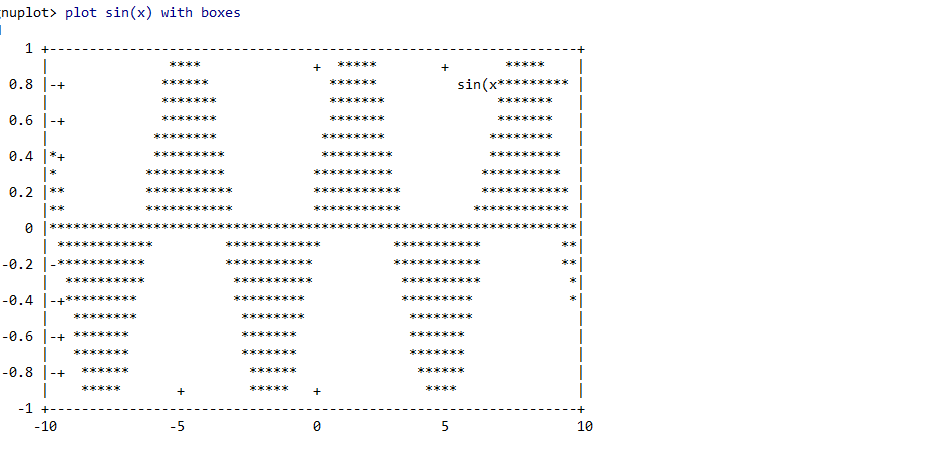
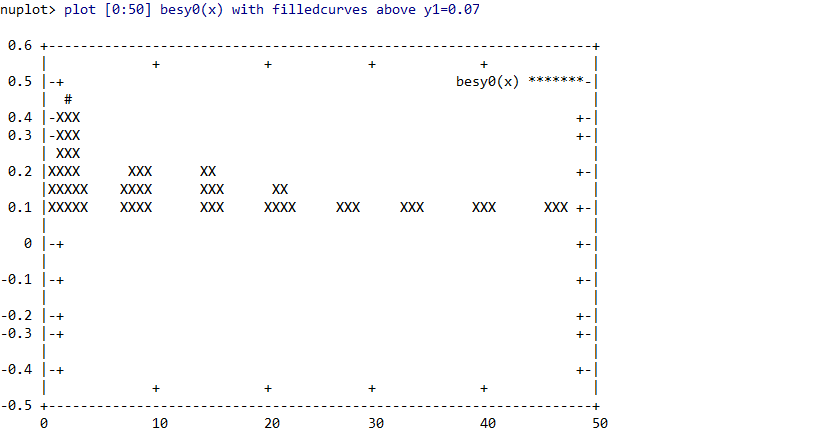
dumb terminal绘制asicii art图形,直接在term看到结果,方便重定向到文本文件

The dumb terminal driver plots into a text block using ascii characters. It has an optional size specification and a trailing linefeed flag.
Syntax:
set terminal dumb {size ,} {[no]feed}
{aspect {,}}
{[no]enhanced}
{mono|ansi|ansi256|ansirgb}
where and set the size of the text block. The default is 79 by 24. The last newline is printed only if feed is enabled.


  1. 当前terminal type

show terminal


  1. terminal type保存/恢复

set terminal push:保存当前工作状态terminal type

set terminal pop:恢复上一次terminal type
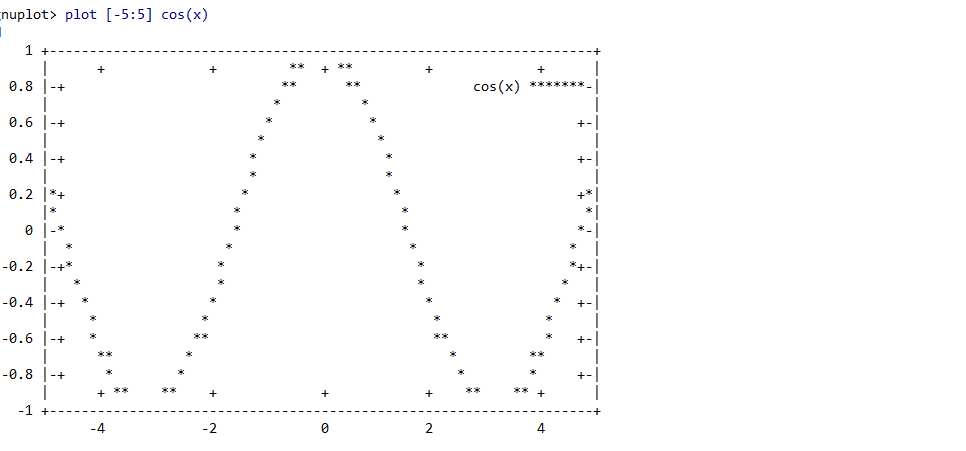
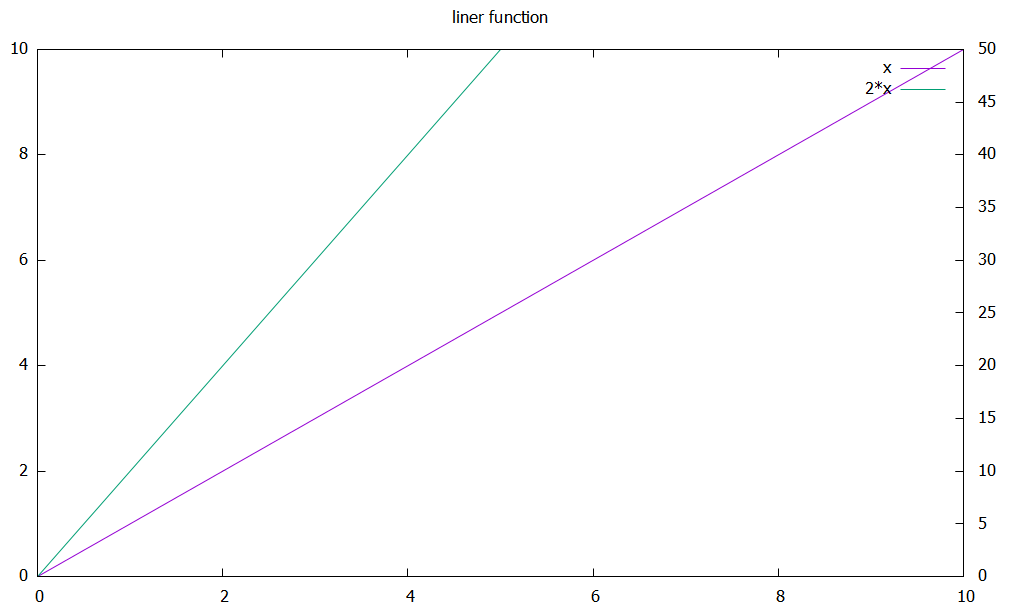
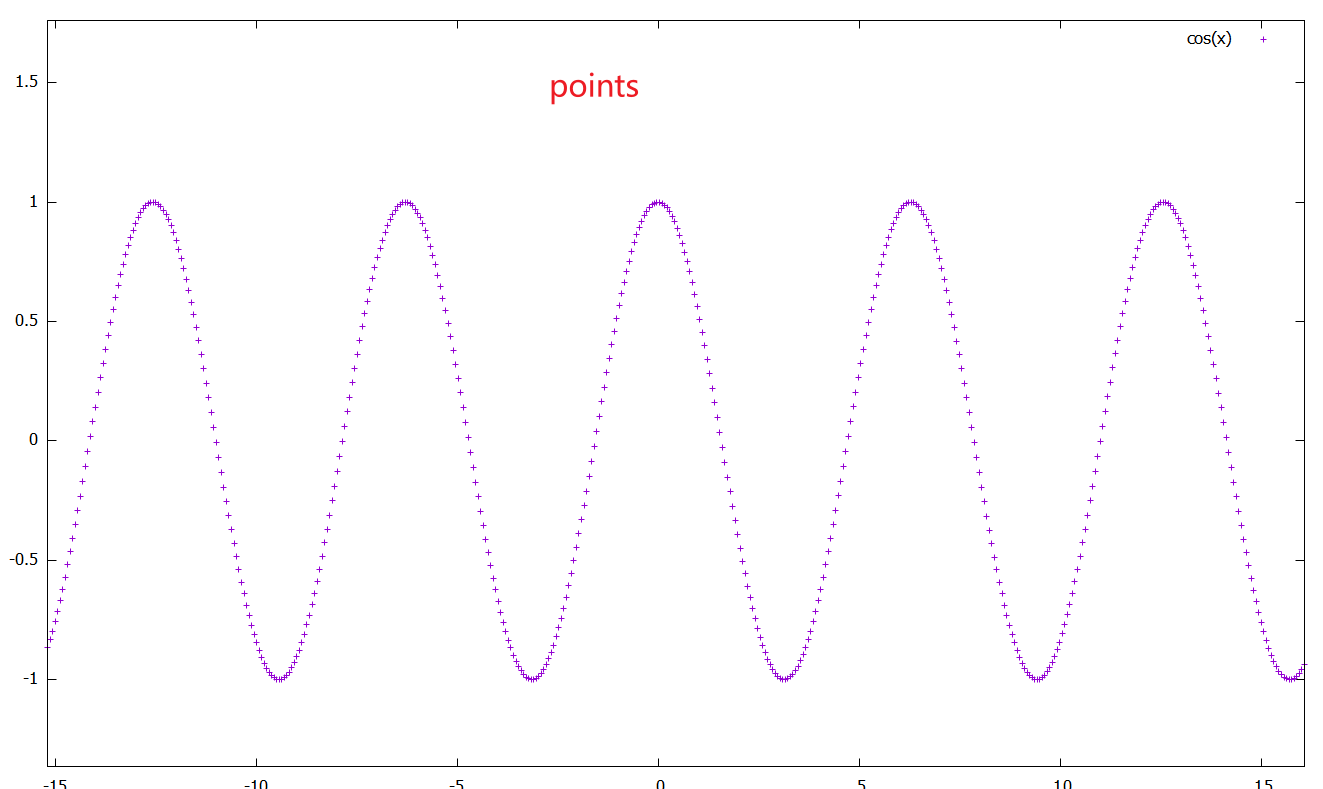


  1. reference


  • output terminals


绘制函数


绘制单个函数

> plot [a:b] function

[a:b]指定函数区间(可省略),function指定函数

image-20220108134131905

image-20220108134345040


绘制多个函数

各个函数用逗号分隔

image-20220108135445630


导出函数数据

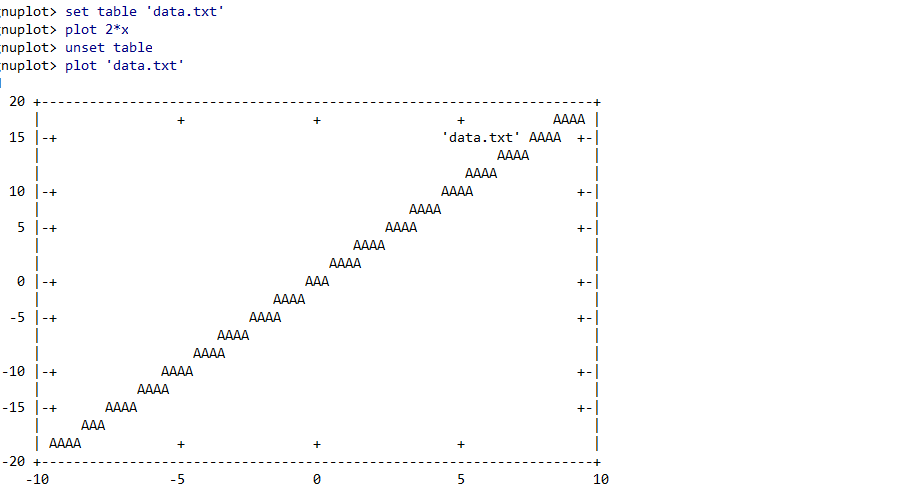
set table 'file' #设置存储数据文件,必须要加上单引号
plot function #导出数据
unset table #退出数据导出模式,进行数据绘制
plot 'file' #通过文件中的数据绘制图形,必须要加上单引号

image-20220108135842636


设定不同区间x/y


  1. gnuplot可以设定两组不同区间x/y,xtics/x2tics,ytics/y2tics分别表示

  2. set y2tics 0,10:0为y轴起始值,10为步长

image-20220108142314489


绘制柱状风格图


  1. plot function with boxes

image-20220108143954221

image-20220108144114525


绘制填充曲线


  1. plot function with filledcurves above y1=0.07

image-20220108164521812

image-20220108164432713


坐标轴设置


x轴设定


  1. set xrange [-1:1]:设置x轴区间为-1到1

  2. set xtics -1,0.2:设置x轴起始值为-1,刻度步长为0.2

  3. set xlable:设置横轴标签

  4. 上述设定同样适用于x2lable,x2tics,x2range


y轴设定


  1. set yrange [-1:1]:设置y轴区间为-1到1

  2. set ytics -1,0.2:设置y轴起始值为-1,刻度步长为0.2

  3. set ylable:设置横轴标签

  4. 上述设定同样适用于y2lable,y2tics,y2range


表头


  1. set title ‘chart name’

image-20220108172056948

image-20220108172126067

image-20220108172334915


绘图颜色/类型


REFERENCE

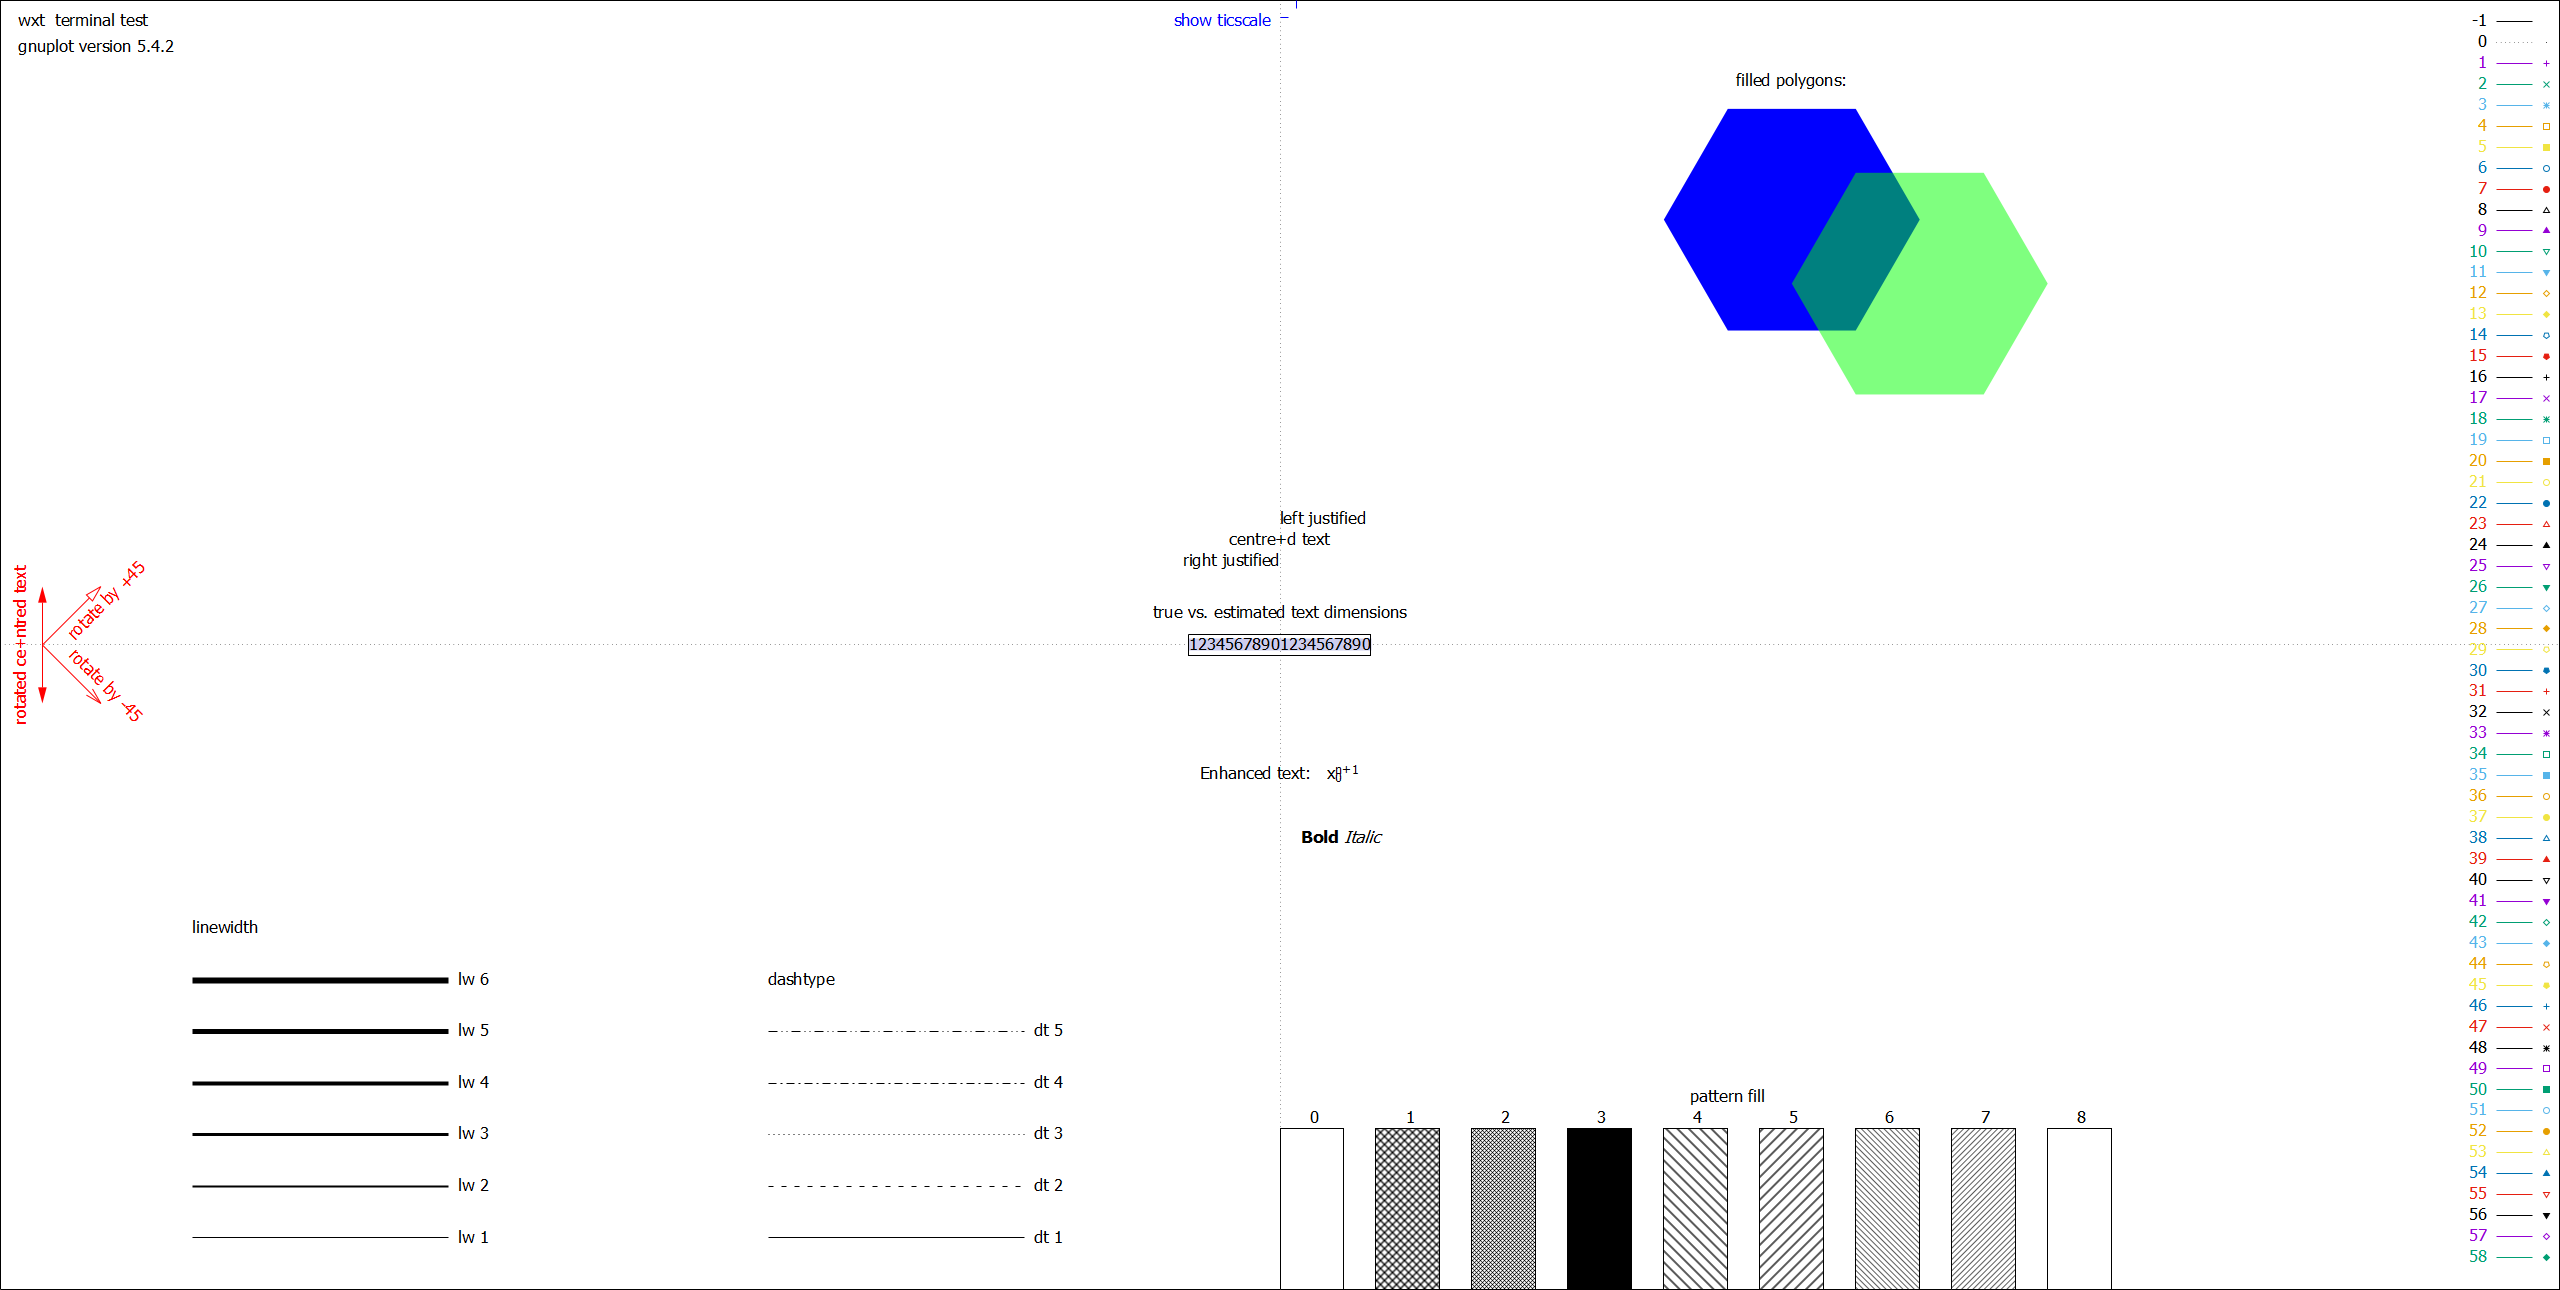
use test command to generate this picture

image-20220108180046997


颜色设置


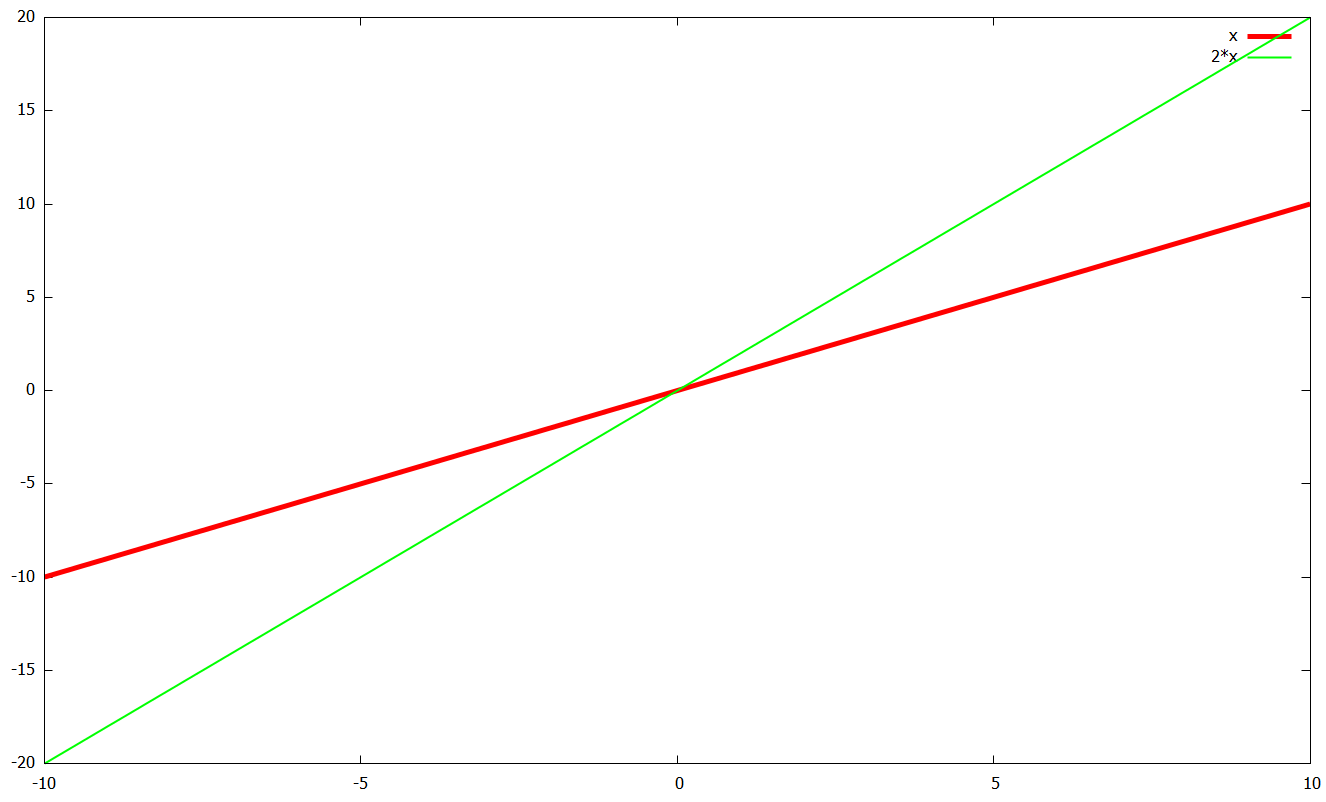
  1. plot function linecolor rgb ‘color’ linecolor可以缩写为lc
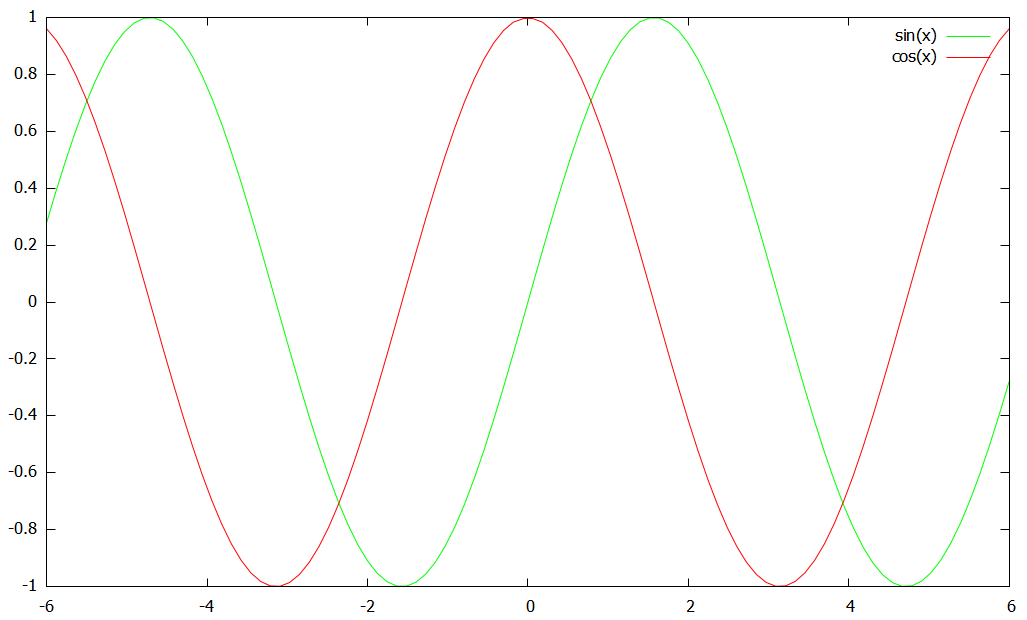
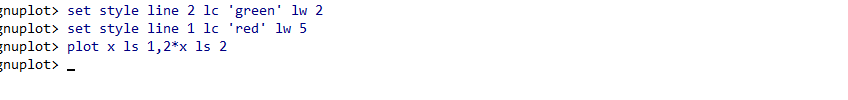
    image-20220108174622921

    image-20220108174331978


设置linestyle


  1. 定义linestyle

    set style line 1 linecolor red linetype 2

    set style line 2 lc green lt 5


  2. 引用linestyle

    plot function ls n

    image-20220109150109217

    image-20220109150209806


设置plot style

image-20220109162459011

image-20220109162612808

image-20220109162648149

image-20220109162534099


设置plot size


  1. set terminal size num1,num2


设置绘图/画布占比


  1. set size num1,num2 num1和num2的设置的范围为0~1,默认为1,填满画布

    set size 0.4,0.4

    image-20220109172036623

    set size 0.8,0.8

    image-20220109172226986


刻度设置


最小刻度

set gride #打开参考点
set mxtics number #设置横轴刻度间格数
set mytics number #设置纵轴刻度间格数

image-20220109185514288

image-20220109185847328


推荐阅读
author-avatar
青岛二三事-丶儿
这个家伙很懒,什么也没留下!
PHP1.CN | 中国最专业的PHP中文社区 | DevBox开发工具箱 | json解析格式化 |PHP资讯 | PHP教程 | 数据库技术 | 服务器技术 | 前端开发技术 | PHP框架 | 开发工具 | 在线工具
Copyright © 1998 - 2020 PHP1.CN. All Rights Reserved | 京公网安备 11010802041100号 | 京ICP备19059560号-4 | PHP1.CN 第一PHP社区 版权所有