第一次写博,没什么经验,主要是把最近自己对Dev的一些研究贴出来大家共同探讨,有不足之处望大家帮忙斧正。
WebChartControl是DevExpress控件群下的一个Web图表控件,它使用非常的方便,生成的图表也相当的漂亮。
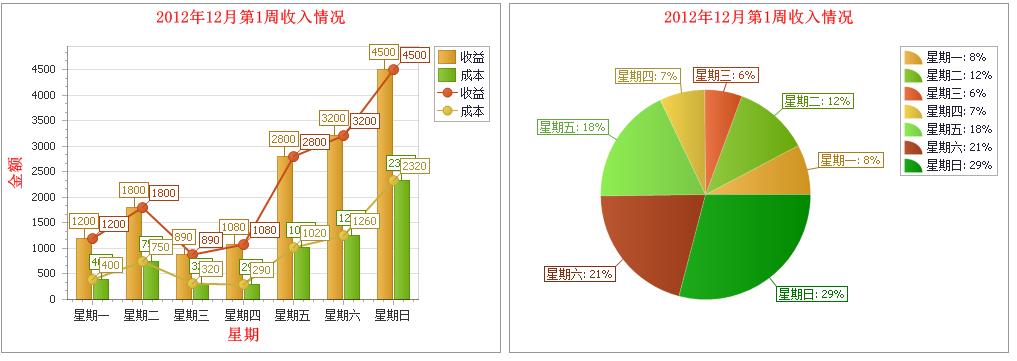
先贴出几张WebChartControl生成的图表:

Web页面代码WebChartControl.aspx:


1 <%@ Page Language="C#" AutoEventWireup="true" CodeBehind="WebChartControl.aspx.cs" Inherits="DevDemo.WebChartControl" %>
2
3 <%@ Register Assembly="DevExpress.XtraCharts.v11.2.Web, Version=11.2.5.0, Culture=neutral, PublicKeyToken=b88d1754d700e49a"
4 Namespace="DevExpress.XtraCharts.Web" TagPrefix="dxchartsui" %>
5
6 <%@ Register assembly="DevExpress.XtraCharts.v11.2, Version=11.2.5.0, Culture=neutral, PublicKeyToken=b88d1754d700e49a" namespace="DevExpress.XtraCharts" tagprefix="cc1" %>
7
8 DOCTYPE html PUBLIC "-//W3C//DTD XHTML 1.0 Transitional//EN" "http://www.w3.org/TR/xhtml1/DTD/xhtml1-transitional.dtd">
9
10 <html xmlns="http://www.w3.org/1999/xhtml">
11 <head runat="server">
12 <title>title>
13 head>
14 <body>
15 <form id="form1" runat="server">
16 <div>
17 <dxchartsui:WebChartControl ID="WebChartControl1" runat="server" Width="500px" Height="350px">
18 dxchartsui:WebChartControl>
19
20 <dxchartsui:WebChartControl ID="WebChartControl3" runat="server" Width="500px" Height="350px">
21 dxchartsui:WebChartControl>
22 <dxchartsui:WebChartControl ID="WebChartControl2" runat="server" Width="500px" Height="350px">
23 dxchartsui:WebChartControl>
24 <dxchartsui:WebChartControl ID="WebChartControl4" runat="server" Width="500px" Height="350px">
25 dxchartsui:WebChartControl>
26 div>
27 form>
28 body>
29 html>
Web页面后台代码WebChartControl.aspx.cs
1 using System;
2 using System.Collections.Generic;
3 using System.Linq;
4 using System.Web;
5 using System.Web.UI;
6 using System.Web.UI.WebControls;
7 using System.Data;
8 using DevExpress.XtraCharts;
9 using System.Drawing;
10
11 namespace DevDemo
12 {
13 public partial class WebChartControl : System.Web.UI.Page
14 {
15 protected void Page_Load(object sender, EventArgs e)
16 {
17 this.DrawBar();
18 this.DrawLine();
19 this.DrawPie();
20 this.DrawBarAndLine();
21 }
22
23 ///
24 /// 绘制柱状图
25 ///
26 private void DrawBar()
27 {
28
29 ChartServices.SetChartTitle(this.WebChartControl1, true, "2012年12月第1周收入情况", true, 2, StringAlignment.Center, ChartTitleDockStyle.Top, true, new Font("宋体", 12, FontStyle.Bold), Color.Red, 10); //如不需显示图表标题可不用调用本段代码,下同
30 ChartServices.DrawChart(this.WebChartControl1, "收益", ViewType.Bar, ServiceData.GetWeekMoneyAndCost(), "week", "money");
31 ChartServices.DrawChart(this.WebChartControl1, "成本", ViewType.Bar, ServiceData.GetWeekMoneyAndCost(), "week", "cost");
32 ChartServices.SetAxisX(this.WebChartControl1, true, StringAlignment.Center, "星期", Color.Red, true, new Font("宋体", 12, FontStyle.Bold)); //如不需显示X轴标题,可不调用该行代码,下同
33 ChartServices.SetAxisY(this.WebChartControl1, true, StringAlignment.Center, "金额", Color.Red, true, new Font("宋体", 12, FontStyle.Bold)); //如不需显示Y轴标题,可不调用该行代码,下同
34 }
35
36 ///
37 /// 绘制折线图
38 ///
39 private void DrawLine()
40 {
41 ChartServices.SetChartTitle(this.WebChartControl3,true,"2012年12月第1周收入情况", true, 2, StringAlignment.Center, ChartTitleDockStyle.Top, true, new Font("宋体", 12, FontStyle.Bold), Color.Red, 10);
42 ChartServices.DrawChart(this.WebChartControl3, "收益", ViewType.Line, ServiceData.GetWeekMoneyAndCost(), "week", "money");
43 ChartServices.DrawChart(this.WebChartControl3, "成本", ViewType.Line, ServiceData.GetWeekMoneyAndCost(), "week", "cost");
44 ChartServices.SetAxisX(this.WebChartControl3, true, StringAlignment.Center, "星期", Color.Red, true, new Font("宋体", 12, FontStyle.Bold));
45 ChartServices.SetAxisY(this.WebChartControl3, true, StringAlignment.Center, "金额", Color.Red, true, new Font("宋体", 12, FontStyle.Bold));
46 }
47
48 ///
49 /// 柱状图和折线图在同一图表中
50 ///
51 private void DrawBarAndLine()
52 {
53 ChartServices.SetChartTitle(this.WebChartControl2,true,"2012年12月第1周收入情况", true, 2, StringAlignment.Center, ChartTitleDockStyle.Top, true, new Font("宋体", 12, FontStyle.Bold), Color.Red, 10);
54 ChartServices.DrawChart(this.WebChartControl2, "收益", ViewType.Bar, ServiceData.GetWeekMoneyAndCost(), "week", "money");
55 ChartServices.DrawChart(this.WebChartControl2, "成本", ViewType.Bar, ServiceData.GetWeekMoneyAndCost(), "week", "cost");
56 ChartServices.SetAxisX(this.WebChartControl2, true, StringAlignment.Center, "星期", Color.Red, true, new Font("宋体", 12, FontStyle.Bold));
57 ChartServices.SetAxisY(this.WebChartControl2, true, StringAlignment.Center, "金额", Color.Red, true, new Font("宋体", 12, FontStyle.Bold));
58
59 ChartServices.SetChartTitle(this.WebChartControl2,false,"2012年12月第1周收入情况", true, 2, StringAlignment.Center, ChartTitleDockStyle.Top, true, new Font("宋体", 12, FontStyle.Bold), Color.Red, 10);
60 ChartServices.DrawChart(this.WebChartControl2, "收益", ViewType.Line, ServiceData.GetWeekMoneyAndCost(), "week", "money");
61 ChartServices.DrawChart(this.WebChartControl2, "成本", ViewType.Line, ServiceData.GetWeekMoneyAndCost(), "week", "cost");
62 ChartServices.SetAxisX(this.WebChartControl2, true, StringAlignment.Center, "星期", Color.Red, true, new Font("宋体", 12, FontStyle.Bold));
63 ChartServices.SetAxisY(this.WebChartControl2, true, StringAlignment.Center, "金额", Color.Red, true, new Font("宋体", 12, FontStyle.Bold));
64 }
65
66 ///
67 /// 绘制饼图
68 ///
69 private void DrawPie()
70 {
71 ChartServices.SetChartTitle(this.WebChartControl4,true,"2012年12月第1周收入情况", true, 2, StringAlignment.Center, ChartTitleDockStyle.Top,true,new Font("宋体", 12, FontStyle.Bold), Color.Red, 10);
72 ChartServices.DrawChart(this.WebChartControl4, ServiceData.GetWeekMoneyAndCost().Rows[0][0].ToString(), ViewType.Pie, ServiceData.GetWeekMoneyAndCost(), "week", "money");
73 }
74 }
75 }
数据提供类ServiceData.cs,主要作用为图表控件提供数据源
1 using System;
2 using System.Collections.Generic;
3 using System.Linq;
4 using System.Web;
5 using System.Data;
6
7 namespace DevDemo
8 {
9 public static class ServiceData
10 {
11 ///
12 /// 获取一周收入和支出数据
13 ///
14 ///
15 public static DataTable GetWeekMoneyAndCost()
16 {
17 DataTable dt = new DataTable();
18 dt.Columns.Add("week", typeof(string));
19 dt.Columns.Add("money", typeof(decimal));
20 dt.Columns.Add("cost", typeof(decimal));
21
22 dt.Rows.Add("星期一", 1200,400);
23 dt.Rows.Add("星期二", 1800,750);
24 dt.Rows.Add("星期三", 890,320);
25 dt.Rows.Add("星期四", 1080,290);
26 dt.Rows.Add("星期五", 2800,1020);
27 dt.Rows.Add("星期六", 3200,1260);
28 dt.Rows.Add("星期日", 4500,2320);
29 return dt;
30 }
31 }
32 }
图表控件辅助类ChartServices.cs,控制生成图表
1 using System;
2 using System.Collections.Generic;
3 using System.Linq;
4 using System.Web;
5 using System.Drawing;
6 using DevExpress.XtraCharts;
7 using System.Data;
8
9 namespace DevDemo
10 {
11 public static class ChartServices
12 {
13 ///
14 /// 绘制图形
15 ///
16 /// 图表控件
17 /// 系列名
18 /// 类型
19 /// 数据源
20 ///
21 ///
22 public static void DrawChart(DevExpress.XtraCharts.Web.WebChartControl control, string seriesName, ViewType type, DataTable dt, string column1, string column2)
23 {
24 Series series = new Series(seriesName, type);
25 DataTable table = dt;
26 SeriesPoint point=null;
27 for (int i = 0; i
28 {
29 point= new SeriesPoint(table.Rows[i][column1].ToString(), Convert.ToDouble(table.Rows[i][column2].ToString()));
30 series.Points.Add(point);
31 }
32 control.Series.Add(series);
33 //针对饼图的特殊处理
34 if(type==ViewType.Pie)
35 {
36 //设置显示方式(Argument:显示图例说明,ArgumentAndValues:显示图例内容和数据)
37 series.Label.PointOptions.PointView = PointView.ArgumentAndValues;
38 //设置数据显示形式(Percent:百分比,Currency:货币类型,数据前添加¥,Scientific:科学计数法)
39 series.Label.PointOptions.ValueNumericOptions.Format = NumericFormat.Percent;
40 //数据是否保留小数(0:不保留小数位,1保留一位小数,2保留两位小数)
41 series.Label.PointOptions.ValueNumericOptions.Precision = 0;
42
43 //数据以百分比显示时只能是Default和None
44 ((PieSeriesLabel)series.Label).ResolveOverlappingMode =ResolveOverlappingMode.Default;
45 }
46 }
47
48 ///
49 /// 设置图表标题
50 ///
51 /// 图表控件
52 /// /// 标题是否可见
53 /// 标题文本
54 /// 是否换行
55 /// 最大允许行数
56 /// 对齐方式
57 /// 位置
58 /// 是否允许设置外观
59 /// 字体
60 /// 文本颜色
61 /// 字体缩进值
62 public static void SetChartTitle(DevExpress.XtraCharts.Web.WebChartControl control,bool isVisible,String text, bool isWordWrop, int maxLineCount, StringAlignment alignment, ChartTitleDockStyle dock, bool isAntialiasing, Font font, Color textColor, int indent)
63 {
64 //设置标题
65 ChartTitle title = new ChartTitle();
66 title.Visible = isVisible;
67 //显示文本
68 title.Text = text;
69 //是否允许换行
70 title.WordWrap = isWordWrop;
71 //最大允许行数
72 title.MaxLineCount = maxLineCount;
73 //对齐方式
74 title.Alignment = alignment;
75 //位置
76 title.Dock = dock;
77 //是否允许设置外观
78 title.Antialiasing = isAntialiasing;
79 //字体
80 title.FOnt= font;
81 //字体颜色
82 title.TextColor = textColor;
83 //缩进值
84 title.Indent = indent;
85 control.Titles.Add(title);
86 }
87
88
89 ///
90 /// 为X轴添加标题
91 ///
92 /// 图形控件
93 /// 标题是否可见
94 /// 对齐方式
95 /// 标题显示文本
96 /// 标题字体颜色
97 /// 是否允许设置外观
98 /// 字体
99 public static void SetAxisX(DevExpress.XtraCharts.Web.WebChartControl control, bool isVisible, StringAlignment aligment, string text, Color color, bool isAntialiasing, Font font)
100 {
101 XYDiagram xydiagram = (XYDiagram)control.Diagram;
102 xydiagram.AxisX.Title.Visible = isVisible;
103 xydiagram.AxisX.Title.Alignment = aligment;
104 xydiagram.AxisX.Title.Text = text;
105 xydiagram.AxisX.Title.TextColor = color;
106 xydiagram.AxisX.Title.Antialiasing = isAntialiasing;
107 xydiagram.AxisX.Title.FOnt= font;
108 }
109
110 ///
111 /// 为X轴添加标题
112 ///
113 /// 图形控件
114 /// 标题是否可见
115 /// 对齐方式
116 /// 标题显示文本
117 /// 标题字体颜色
118 /// 是否允许设置外观
119 /// 字体
120 public static void SetAxisY(DevExpress.XtraCharts.Web.WebChartControl control, bool isVisible, StringAlignment aligment, string text, Color color, bool isAntialiasing, Font font)
121 {
122 XYDiagram xydiagram = (XYDiagram)control.Diagram;
123 xydiagram.AxisY.Title.Visible = isVisible;
124 xydiagram.AxisY.Title.Alignment = aligment;
125 xydiagram.AxisY.Title.Text = text;
126 xydiagram.AxisY.Title.TextColor = color;
127 xydiagram.AxisY.Title.Antialiasing = isAntialiasing;
128 xydiagram.AxisY.Title.FOnt= font;
129 }
130 }
131 }
以上为本人的一点小小研究,如有不足之处,望不吝赐教!
转自:http://www.cnblogs.com/huabao-wei/archive/2012/12/17/DevWebChartControl.html


![[译]技术公司十年经验的职场生涯回顾](https://img8.php1.cn/3cdc5/24912/711/b6574f3292f9dc00.png)

 京公网安备 11010802041100号