作者:浮云 | 来源:互联网 | 2023-05-18 13:19
我想在D3中将饼图与强制网络结合起来.我目前正在使用部队网络(如下所示).我想将每个气泡变成饼图.这是可能的,因为它们具有不同的半径.任何一般方法将不胜感激.谢谢!
这是当前的Javascript代码:
d3.json("data/d3data.json", function(error, graph) {
var new_nodes = convert(graph.nodes);
force
.nodes(new_nodes)
// .links(graph.links)
.start();
var root = new_nodes[0];
root.fixed = true;
var loading = svg.append("text")
.attr("x", width / 2)
.attr("y", height / 2)
.attr("dy", ".35em")
.style("text-anchor", "middle")
.text("Simulating. One moment please…");
var node = svg.selectAll("svg")
.data(new_nodes)
.enter().append("svg")
.attr("width", function(d) { return Math.sqrt(d.followersCount/100)*2;})
.attr("height", function(d) { return Math.sqrt(d.followersCount/100)*2;});
var g = node.append("g")
.attr("transform", function(d) { return "translate(" + d.r + "," + d.r + ")"});
var g_2 = node.selectAll("g")
.data(function(d) {
console.log(pie(d.FFratio));
return pie(d.FFratio);})
.enter() .append("g");
g_2.append("path")
.attr("d", d3.svg.arc().outerRadius(10))
.style("fill", function (d, i) {
return color(i);
})
function tick(){
var node_x = 0;
var node_y = 0;
node.attr("x", function(d) { node_x = d.x; return d.x; })
.attr("y", function(d) { node_y = d.y;return d.y; });
}
loading.remove();
force.on("tick", function ticky(e){
var q = d3.geom.quadtree(graph.nodes),
i = 0,
n = graph.nodes.length;
while (++i nx2 || x2 ny2 || y2

1> Mark..:
这是我刚刚根据聚类力布局编码的示例.
关键是要替换聚集力circle用g,然后可以循环,并建立内部的饼图:
var pies = svg.selectAll(".pie")
.data(nodes)
.enter().append("g")
.attr("class","pie")
.call(force.drag);
pies.each(function(d,i){
var pieG = d3.select(this);
var arc = d3.svg.arc()
.outerRadius(d.radius)
.innerRadius(0);
var pie = d3.layout.pie()
.sort(null)
.value(function(d) {
return d;
});
var data = [Math.random(), Math.random(), Math.random(), Math.random()];
var g = pieG.selectAll(".arc")
.data(pie(data))
.enter().append("g")
.attr("class", "arc");
g.append("path")
.attr("d", arc)
.attr("fill", function(d,i){
return colors(i);
})
});
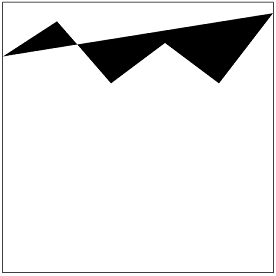
产生这个:


 京公网安备 11010802041100号