下载地址:https://github.com/martinlindhe/wmi_exporter/releases
A Prometheus exporter for Windows machines. 可以帮助收集windows上的CPU、内存、磁盘、网络
| Name | Description | Enabled by default |
|---|---|---|
| ad | Active Directory Domain Services | |
| adfs | Active Directory Federation Services | |
| cpu | CPU usage | ✓ |
| cs | "Computer System" metrics (system properties, num cpus/total memory) | ✓ |
| container | Container metrics | |
| dhcp | DHCP Server | |
| dns | DNS Server | |
| exchange | Exchange metrics | |
| fsrmquota | Microsoft File Server Resource Manager (FSRM) Quotas collector | |
| hyperv | Hyper-V hosts | |
| iis | IIS sites and applications | |
| logical_disk | Logical disks, disk I/O | ✓ |
| logon | User logon sessions | |
| memory | Memory usage metrics | |
| msmq | MSMQ queues | |
| mssql | SQL Server Performance Objects metrics | |
| netframework_clrexceptions | .NET Framework CLR Exceptions | |
| netframework_clrinterop | .NET Framework Interop Metrics | |
| netframework_clrjit | .NET Framework JIT metrics | |
| netframework_clrloading | .NET Framework CLR Loading metrics | |
| netframework_clrlocksandthreads | .NET Framework locks and metrics threads | |
| netframework_clrmemory | .NET Framework Memory metrics | |
| netframework_clrremoting | .NET Framework Remoting metrics | |
| netframework_clrsecurity | .NET Framework Security Check metrics | |
| net | Network interface I/O | ✓ |
| os | OS metrics (memory, processes, users) | ✓ |
| process | Per-process metrics | |
| remote_fx | RemoteFX protocol (RDP) metrics | |
| service | Service state metrics | ✓ |
| system | System calls | ✓ |
| tcp | TCP connections | |
| thermalzone | Thermal information | |
| terminal_services | Terminal services (RDS) | |
| textfile | Read prometheus metrics from a text file | ✓ |
| vmware | Performance counters installed by the Vmware Guest agent |
有关报指标,配置设置和使用示例的更多信息,请参见每个收集器上的链接文档。
下载地址:https://github.com/zhebrak/nvidia_smi_exporter
他是用于Prometheus的一个nvidia-smi metrics exporter ,可以帮助手机windows中的GPU信息,相当于执行了如下命令
nvidia-smi --query-gpu=name,index,temperature.gpu,utilization.gpu,utilization.memory,memory.total,memory.free,memory.used --format=csv,noheader,nounits
(1)打开cmd窗口(win+R,再输入cmd)
(2)进入C:\Program Files\NVIDIA Corporation\NVSMI中,执行nvidia-smi.exe
C:\Users\Administrator
λ cd C:\Program Files\NVIDIA Corporation\NVSMIC:\Program Files\NVIDIA Corporation\NVSMI
λ nvidia-smi.exe -l
Fri Aug 28 10:58:21 2020
+-----------------------------------------------------------------------------+
| NVIDIA-SMI 446.14       Driver Version: 446.14       CUDA Version: 11.0     |
|-------------------------------+----------------------+----------------------+
| GPU  Name            TCC/WDDM | Bus-Id        Disp.A | Volatile Uncorr. ECC |
| Fan  Temp  Perf  Pwr:Usage/Cap|         Memory-Usage | GPU-Util  Compute M. |
|===============================+======================+======================|
|   0  GeForce GTX 106... WDDM  | 00000000:01:00.0  On |                  N/A |
| 27%   36C    P8    10W / 120W |   1079MiB /  6144MiB |      2%      Default |
+-------------------------------+----------------------+----------------------++-----------------------------------------------------------------------------+
| Processes:                                                                  |
|  GPU                  PID   Type   Process name                  GPU Memory |
|                                                                  Usage      |
|=============================================================================|
|    0                  680    C+G   ...lPanel\SystemSettings.exe    N/A      |
|    0                 1388    C+G   ...U-2019.1.3\bin\idea64.exe    N/A      |
|    0                 1704    C+G   ...w5n1h2txyewy\SearchUI.exe    N/A      |
|    0                 2328    C+G   ...gram\WeChat\WeChatApp.exe    N/A      |
|    0                 3220    C+G   ...sk\baidunetdiskrender.exe    N/A      |
|    0                 5296    C+G   ...y\ShellExperienceHost.exe    N/A      |
|    0                 5940    C+G   ...me\Application\chrome.exe    N/A      |
|    0                 6976    C+G   ...b3d8bbwe\WinStore.App.exe    N/A      |
|    0                 8636    C+G   ...ekyb3d8bbwe\YourPhone.exe    N/A      |
|    0                 8664    C+G   ...es.TextInput.InputApp.exe    N/A      |
|    0                 9880    C+G   ...kyb3d8bbwe\Calculator.exe    N/A      |
|    0                11552    C+G   ...2701\Applet\WeChatApp.exe    N/A      |
|    0                11560    C+G   ...1055.127\DesktopMgr64.exe    N/A      |
|    0                11864    C+G   ...gram\WeChat\wechatweb.exe    N/A      |
|    0                12840    C+G   Insufficient Permissions        N/A      |
|    0                13792    C+G   C:\Windows\explorer.exe         N/A      |
|    0                16004    C+G   ...typora\program\Typora.exe    N/A      |
+-----------------------------------------------------------------------------+
表格中会显示显卡的一些信息,第一行是版本信息,第二行是标题栏,第三行就是具体的显卡信息了,如果有多个显卡,会有多行,每一行的信息值对应标题栏对应位置的信息。
GPU:编号,0
Name:显卡名,NVS 4200M
TCC/WDDM:WDDM
Fan:风扇转速,在0到100%之间变动。N/A,表示没转
Temp:显卡温度,这里是66摄氏度
Perf:性能状态,congP0-P12,P0性能最大,P12最小,这里是P0
Pwr:能耗,Usage是使用量,Cap是总量
BusId:涉及GPU总线
Disp.A:表示GPU的显示是否已经初始化
Memory-Usage:显存使用率,这里才用很少,5%不到
CPU-Util:GPU利用率
Compute M:计算模式
需要注意的一点是显存占用率和GPU占用率是两个不一样的东西,类似于内存和CPU,两个指标的占用率不一定是互相对应的。
下载地址:https://prometheus.io/download/
选择windows 版本即可
下载地址:https://grafana.com/grafana/download
选择windows 版本即可
- 下载地址:https://github.com/martinlindhe/wmi_exporter/releases选择最新msi文件下载安装即可。
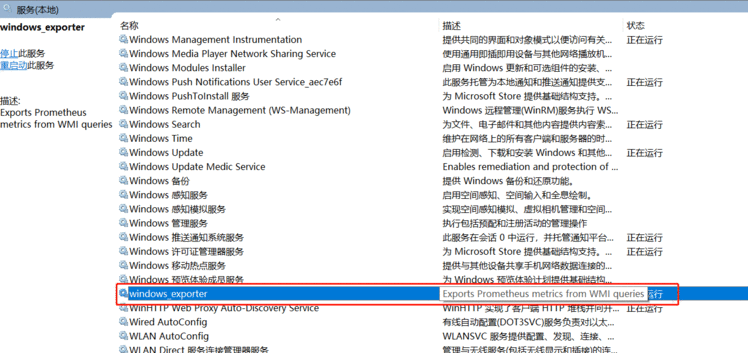
- 完成安装后会自动创建一个开机自启的服务,通过服务(services.msc)判断是否有有windows_exporter
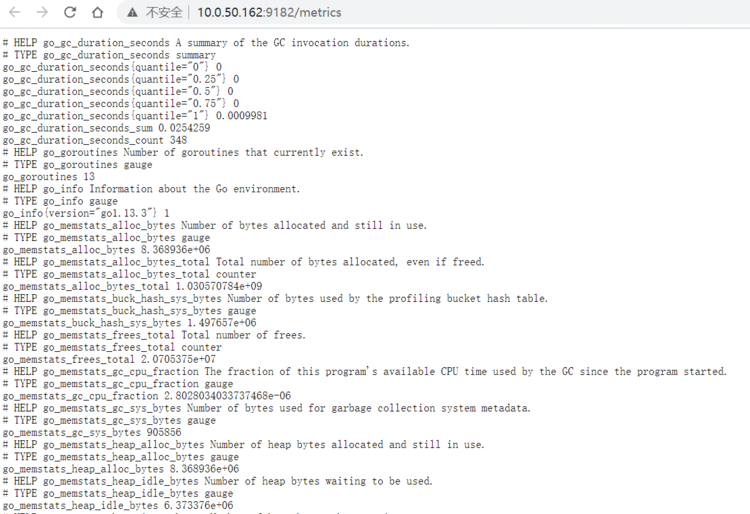
- 通过访问http://ip+默认端口9182(如:http://localhost:9182) 出现下图,即代表安装采集数据成功。
依赖于go的编译环境
go的下载:https://golang.google.cn/dl/
> go build -v nvidia_smi_exporter
会自动生成一个nvidia_smi_exporter.exe文件
> ./nvidia_smi_exporter [
Default port is 9101
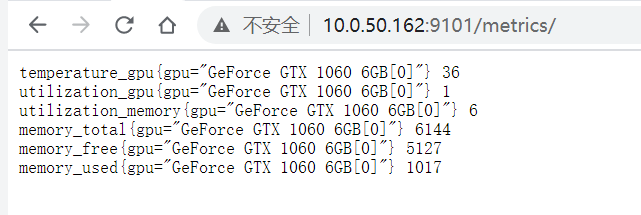
temperature_gpu{gpu="TITAN X (Pascal)[0]"} 41
utilization_gpu{gpu="TITAN X (Pascal)[0]"} 0
utilization_memory{gpu="TITAN X (Pascal)[0]"} 0
memory_total{gpu="TITAN X (Pascal)[0]"} 12189
memory_free{gpu="TITAN X (Pascal)[0]"} 12189
memory_used{gpu="TITAN X (Pascal)[0]"} 0
temperature_gpu{gpu="TITAN X (Pascal)[1]"} 78
utilization_gpu{gpu="TITAN X (Pascal)[1]"} 95
utilization_memory{gpu="TITAN X (Pascal)[1]"} 59
memory_total{gpu="TITAN X (Pascal)[1]"} 12189
memory_free{gpu="TITAN X (Pascal)[1]"} 1738
memory_used{gpu="TITAN X (Pascal)[1]"} 10451
temperature_gpu{gpu="TITAN X (Pascal)[2]"} 83
utilization_gpu{gpu="TITAN X (Pascal)[2]"} 99
utilization_memory{gpu="TITAN X (Pascal)[2]"} 82
memory_total{gpu="TITAN X (Pascal)[2]"} 12189
memory_free{gpu="TITAN X (Pascal)[2]"} 190
memory_used{gpu="TITAN X (Pascal)[2]"} 11999
temperature_gpu{gpu="TITAN X (Pascal)[3]"} 84
utilization_gpu{gpu="TITAN X (Pascal)[3]"} 97
utilization_memory{gpu="TITAN X (Pascal)[3]"} 76
memory_total{gpu="TITAN X (Pascal)[3]"} 12189
memory_free{gpu="TITAN X (Pascal)[3]"} 536
memory_used{gpu="TITAN X (Pascal)[3]"} 11653
nvidia-smi --query-gpu=name,index,temperature.gpu,utilization.gpu,utilization.memory,memory.total,memory.free,memory.used --format=csv,noheader,nounits
- job_name: "gpu_exporter"static_configs:- targets: ['localhost:9101']
- 下载地址:https://prometheus.io/download/
- 选择windows 版本即可
下载解压后,修改配置文件,修改新增windows_exporter、nvidia_smi_exporter数据采集器配置:
# my global config
global:scrape_interval: 15s # Set the scrape interval to every 15 seconds. Default is every 1 minute.evaluation_interval: 15s # Evaluate rules every 15 seconds. The default is every 1 minute.# scrape_timeout is set to the global default (10s).# Alertmanager configuration
alerting:alertmanagers:- static_configs:- targets:# - alertmanager:9093# Load rules once and periodically evaluate them according to the global 'evaluation_interval'.
rule_files:# - "first_rules.yml"# - "second_rules.yml"# A scrape configuration containing exactly one endpoint to scrape:
# Here it's Prometheus itself.
scrape_configs:# The job name is added as a label `job=
启动,cmd进入安装目录(& – -> 后台运行)
prometheus.exe --config.file=prometheus.yml --web.listen-address=:9090 &
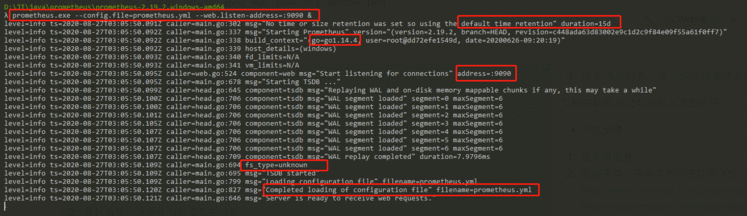
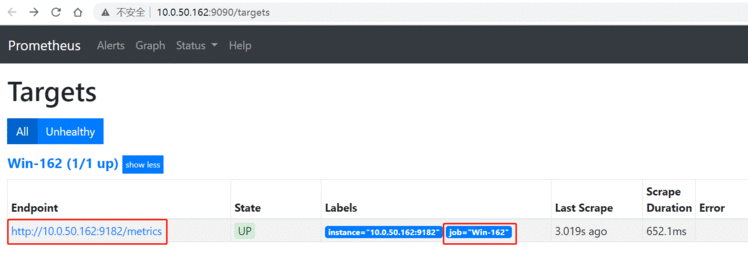
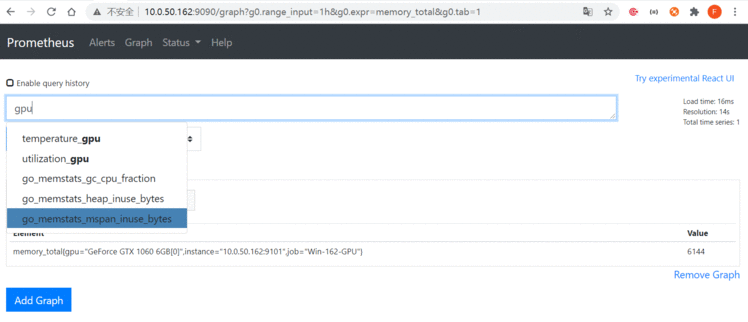
访问 http://ip:9090 ,(如:http://localhost:9090)出现如下界面即为prometheus安装成功、数据采集器验证成功 (PS: up为成功,down 为不成功。)
- 下载地址:https://grafana.com/grafana/download
- 选择windows 版本即可
解压完成,进入bin目录启动grafana-server.exe 打开浏览器访问 http://ip:3000,(如:http://localhost:3000) 用户名/密码 admin/admin
Configuration -- Add data source --- Prometheus , 输入名称,prometheus的访问url ,点击保存测试,验证是否成功

访问地址:https://grafana.com/dashboards --- serch框输入windows ---- 选择心仪模板 (注意模板所支持的数据源为prometheus) ----- 进行 ID 或者JOSN文件两种方式导入。
推荐使用ID
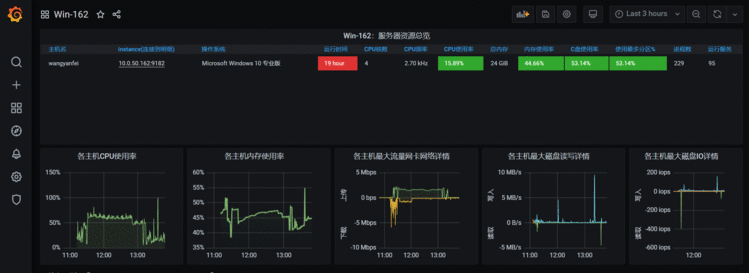
仪表盘模板推荐
模板ID: 10467
-- Windows的Prometheus监控看板展示,增加了资源汇总展示,优化了明细展示。更新支持windows_exporter 0.13.0。
模板导入成功即可看到监控数据


 京公网安备 11010802041100号 | 京ICP备19059560号-4 | PHP1.CN 第一PHP社区 版权所有