作者:僾媙 | 来源:互联网 | 2023-08-28 16:05
因项目需要最近调研了使用Prometheus+Grafana实现应用程序可视化监控,现将调研成果记录下来以便后续查找,同时也分享给读者,希望能起到一些作用。

快速开始
1、Spring Boot应用暴露监控指标【版本2.0.1.RELEASE】
首先添加依赖如下:
			org.springframework.boot
			spring-boot-starter-actuator


			org.springframework.boot
			spring-boot-starter-web


			io.micrometer
			micrometer-registry-prometheus
然后在application.properties配置监控指标:
server.port=8090
server.servlet.context-path=/monitoring
management.endpoints.web.exposure.include=*
启动应用程序,访问http://localhost:8090/monitoring/actuator,可以看到springboot actuator相关指标

因为集成的是Prometheus,找到并访问http://localhost:8090/monitoring/actuator/prometheus,可以看到Prometheus格式的指标数据
2、Prometheus采集应用指标数据
这里我们使用docker镜像的方式使用Prometheus
首先,获取Prometheus的Docker镜像:
docker pull prom/prometheus
然后,编写prometheus.yml配置文件:
#Global configurations
global:
  scrape_interval: 10s
  scrape_timeout: 10s
  evaluation_interval: 10m
scrape_configs:
  - job_name: prometheus
    scrape_interval: 5s
    scrape_timeout: 5s
    metrics_path: /monitoring/actuator/prometheus
    scheme: http
    static_configs:
      - targets:
        - localhost:8090 #此处为Spring Boot应用程序的IP+端口
接下来,启动Prometheus:
docker run -d --name prometheus
-p 9090:9090 -m 500M
-v "$(pwd)/prometheus.yml":/prometheus.yml
-v "$(pwd)/data":/data
prom/prometheus
--config.file=/prometheus.yml
--log.level=info
$(pwd)表示刚才编写的prometheus.yml存放位置,我的存放在:/opt/prometheus/prometheus.yml
最后,访问http://localhost:9090/targets,检查Spring Boot采集状态是否正常

3、Grafana 可视化监控数据
首先,获取Grafana的Docker镜像
docker pull grafana/grafana
然后,启动Grafana
docker run --name grafana -d -p 3000:3000 grafana/grafana接着,访问http://localhost:3000,配置数据源
默认登录帐号密码为:admin/admin

最后,配置单个指标的监控面板

指标名只能填写已有的指标,具体可以在Prometheus看到,即http://localhost:9090/graph

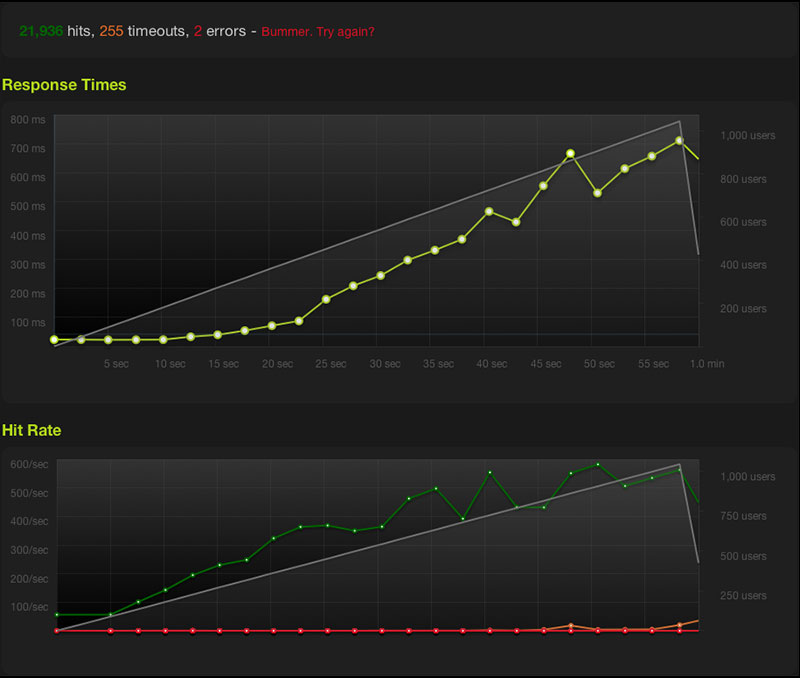
下图为配置好的Grafana监控面板图,读者可自行多配置几个

以上就是本次调研成果,如有什么地方不对的,欢迎指正。


 京公网安备 11010802041100号