作者:枇杷语1314 | 来源:互联网 | 2023-06-22 12:50
文章目录1、配置PHP-FPM,暴露php-fpm状态信息2、bakinsphp-fpm-exporter监控PHP应用2.1、配置php状态页的http访问2.2、
文章目录 1、配置PHP-FPM,暴露php-fpm状态信息 2、bakins/php-fpm-exporter监控PHP应用 2.1、配置php状态页的http访问 2.2、下载bakins/php-fpm-exporter 2.3、配置为系统服务 2.4、配置防火墙 2.5、与Prometheus集成 2.6、与Grafana集成 3、hipages/php-fpm_exporter监控php应用 3.1、下载 3.2、配置为系统服务 3.3、与Prometheus集成 3.4、与Grafana集成
要监控PHP状态信息,必须先配置显示PHP状态页,这样Prometheus才能通过Exporter进行监控。
1、配置PHP-FPM,暴露php-fpm状态信息 官方参考:https://easyengine.io/tutorials/php/fpm-status-page/
pm.status_path = /status
目前可用于监控PHP的Exporter有三个:
https://github.com/bakins/php-fpm-exporter https://github.com/hipages/php-fpm_exporter https://github.com/Lusitaniae/phpfpm_exporter 本文只介绍前边两个
2、bakins/php-fpm-exporter监控PHP应用 bakins/php-fpm-exporter只能通过http读取PHP状态页信息,需要借助nginx来提供PHP状态页数据
2.1、配置php状态页的http访问 nginx.conf
server {listen 9010; allow 127.0.0.1; #限制ipallow 192.168.28.131; #限制ipdeny all;location ~ ^/(status|ping)$ {fastcgi_pass unix:/tmp/php-cgi.sock; # unix socket#fastcgi_pass 127.0.0.1:9000; # tcpfastcgi_param SCRIPT_FILENAME $document_root$fastcgi_script_name;include fastcgi_params;}
查看状态页数据
[root@ ~]# curl http://127.0.0.1:9010/status# php-fpm状态页的内容如下
2.2、下载bakins/php-fpm-exporter 下载地址:https://github.com/bakins/php-fpm-exporter
mv php-fpm-exporter.linux.amd64 /usr/local/php-fpm-exporter]Flags:-h, --help Show context-sensitive help (also try --help-long and --help-man).--addr="127.0.0.1:8080" listen address for metrics handler--endpoint="http://127.0.0.1:9000/status" url for php-fpm status--fastcgi=FASTCGI fastcgi url. If this is set, fastcgi will be used instead of HTTP--web.telemetry-path="/metrics"Path under which to expose metrics. Cannot be /# 运行
查看转成Prometheus监控指标的状态页数据
[root@s2 ~]# curl http://127.0.0.1:9011/metrics
2.3、配置为系统服务 vi /usr/lib/systemd/system/php_exporter.service
[Unit]
php_exporter服务命令
systemctl daemon-reload enable php_exporter
2.4、配置防火墙 如果端口未开启,需要开启相关端口
#启动防火墙
2.5、与Prometheus集成 prometheus.yml
scrape_configs:- job_name: 'PHP-FPM'static_configs:- targets: ['192.168.28.132:9011','192.168.28.136:9011']
重新加载配置
curl -X POST http://127.0.0.1:9090/-/reload # prmetheus不需要登录
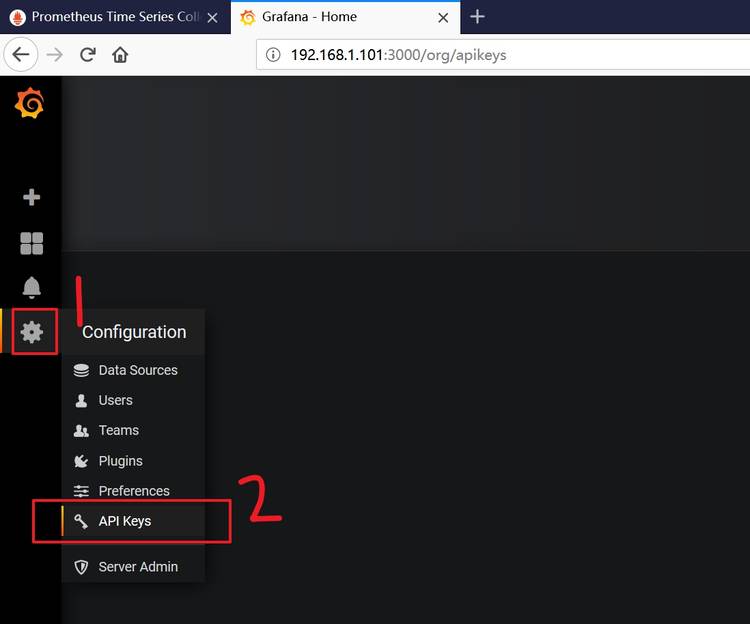
2.6、与Grafana集成 可视化模板:https://grafana.com/grafana/dashboards/3901-php-fpm/
3、hipages/php-fpm_exporter监控php应用 3.1、下载 下载:https://github.com/hipages/php-fpm_exporter
mv php-fpm_exporter_2.2.0_linux_amd64 /usr/local/php-fpm_exporterchmod u+x /usr/local/php-fpm_exportersudo -u www /usr/local/php-fpm_exporter get --phpfpm.scrape-uri "unix:///tmp/php-cgi.sock;/status" sudo -u www /usr/local/php-fpm_exporter server --web.listen-address ":9253" --phpfpm.scrape-uri "unix:///tmp/php-cgi.sock;/status" curl http://127.0.0.1:9253/metrics
3.2、配置为系统服务 vi /usr/lib/systemd/system/php_exporter2.service
[ Unit] Description = php_exporter2Wants = network-online.targetAfter = network-online.target[ Service] User = wwwGroup = wwwType = simpleExecStart = /usr/local/php-fpm_exporter server \ --web.listen-address ":9253" \ --web.telemetry-path "/metrics" \ --phpfpm.scrape-uri "unix:///tmp/php-cgi.sock;/status" [ Install] WantedBy = multi-user.target
php_exporter2服务命令
systemctl daemon-reload enable php_exporter2
vi /etc/passwd
www:x:1002:1002::/home/www:/sbin/nologin
3.3、与Prometheus集成 scrape_configs:- job_name: 'PHP-FPM2'static_configs:- targets: ['192.168.28.136:9253']labels:namespace: '192.168.28.136:9253'- targets: ['192.168.28.132:9253']labels:namespace: '192.168.28.132:9253'
3.4、与Grafana集成 可视化模板:https://grafana.com/grafana/dashboards/15796-php-fpm/


 京公网安备 11010802041100号