- Download
source file (C#) - 1.6 KB - Download
demo - 14.4 KB - Download
source [VB.NET] - 1.98 KB - Download
demo [VB.NET] - 15 KB
Introduction
Displaying data in tabular form is an essential part of any application
nowadays. But sometimes you need to display a huge amount of data in terms of
number of rows. It becomes very difficult to analyse if the number of rows is
huge. In such cases, you may wish to summarize your data in the other formats
like charts, graphs, groups, pivots, etc. This article presents a simplified way
to pivot your data with an appropriate aggregate function so that you can
enhance your reports easily. Based on the feedback given by various readers,
more features have been provided to pivot class. The pivot class is now capable
to pivot data on both the axis at a time. Moreover, it also has the facility to
do sub-total column wise.
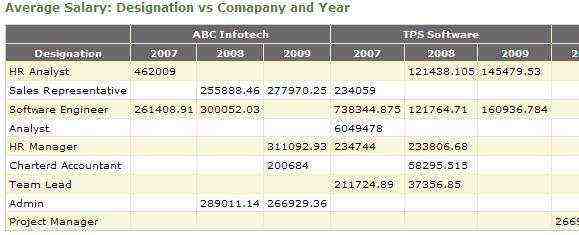
Below is a screenshot of pivoted data in a GridView:
 >
>
How it Works
To simplify the scenario, I have divided the result table into three areas: RowField, DataField, and ColumnFields. If
you wish to do pivot on both the axis, you may use another overload of the same
method where you just need to pass RowFields parameter as an array.
Apart from the area, the Pivot class provides you the option to
bind your data based on some aggregate functions. The various aggregate options
available are:
Count: Returns the count of matching dataSum: Returns the sum of matching data (to get the sum, the
type of theDataFieldmust be convertible to decimal type)First: Returns the first occurrence of matching dataLast: Returns the last occurrence of matching dataAverage: Returns the average of matching data (to get the
average, the type of theDataFieldmust be convertible to decimal
type)Max: Returns the maximum value from the matching dataMin: Returns the minimum value from the matching dataExists: Returns "true" if there is any
matching data, else "false"
The code mainly contains a class named "Pivot" that takes the DataTable in the constructor. ColumnFields takes as a
string array parameter which allows you to pivot data on more than one column.
It contains a function called PivotData() which actually pivots
your data.
>
Collapse | Copy
Code
public DataTable PivotData(string RowField, string DataField, First of all, the function determines the number of rows by getting the private object GetData(string Filter, string DataField, AggregateFunction Aggregate) This function first filters out the matching Using the code is simple. Create an instance of the DataTable dt = ExcelLayer.GetDataTable("_Data\\DataForPivot.xls", "Sheet1$"); The database used as a sample is an Excel sheet and is present in the The private void MergeHeader(GridView gv, GridViewRow row, int PivotLevel) The function creates a new row for each pivot level and merges accordingly. The For example, suppose a pivot is done on three This may needs to be done when you are pivoting your data row-wise also. Here private void MergeRows(GridView gv, int rowPivotLevel) The code to merge header rows is fairly simple. It simply loops through all Screen shot for both side pivot: Below is the screenshot of the Along with pivoting the You may also wish to consider the following link to pivot a Currently, the code can pivot data only for a
AggregateFunction Aggregate, params string[] ColumnFields)
{
DataTable dt = new DataTable();
string Separator = ".";
var RowList = (from x in _SourceTable.AsEnumerable()
select new { Name = x.Field<object>(RowField) }).Distinct();
var ColList = (from x in _SourceTable.AsEnumerable()
select new { Name = ColumnFields.Select(n => x.Field<object>(n))
.Aggregate((a, b) => a += Separator + b.ToString()) })
.Distinct()
.OrderBy(m => m.Name);
dt.Columns.Add(RowField);
foreach (var col in ColList)
{
dt.Columns.Add(col.Name.ToString());
}
foreach (var RowName in RowList)
{
DataRow row = dt.NewRow();
row[RowField] = RowName.Name.ToString();
foreach (var col in ColList)
{
string strFilter = RowField + " = ‘" + RowName.Name + "‘";
string[] strColValues =
col.Name.ToString().Split(Separator.ToCharArray(),
StringSplitOptions.None);
for (int i = 0; i
" = ‘" + strColValues[i] + "‘";
row[col.Name.ToString()] = GetData(strFilter, DataField, Aggregate);
}
dt.Rows.Add(row);
}
return dt;
}PivotData method also has 2 more overloads. If you wish to show
column wise sub-total, you may use the overload by passing a bool variable showSubTotal. If you wish to Pivot
your data on both side, i.e., row-wise as well as column-wise, you may wish to
use another overload where you can pass rowFields and columnFields as an array.
distinct values in RowList, and the number of columns by getting
the distinct values in ColList. Then, the columns are created. It
then iterates through each row and gets the matching values to the corresponding
cell based on the aggregate function provided. To retrieve the matching value,
the GetData() function is called.id="preimg1" src="https://img8.php1.cn/3cdc5/125e8/978/fea424fcd874c583.gif"
>
Collapse | Copy
Code
{
try
{
DataRow[] FilteredRows = _SourceTable.Select(Filter);
object[] objList =
FilteredRows.Select(x => x.Field<object>(DataField)).ToArray();
switch (Aggregate)
{
case AggregateFunction.Average:
return GetAverage(objList);
case AggregateFunction.Count:
return objList.Count();
case AggregateFunction.Exists:
return (objList.Count() == 0) ? "False" : "True";
case AggregateFunction.First:
return GetFirst(objList);
case AggregateFunction.Last:
return GetLast(objList);
case AggregateFunction.Max:
return GetMax(objList);
case AggregateFunction.Min:
return GetMin(objList);
case AggregateFunction.Sum:
return GetSum(objList);
default:
return null;
}
}
catch (Exception ex)
{
return "#Error";
}
return null;
}RowField and ColumnFields data in the DataRow[] array and then
applies the aggregate function on it.Using the Code
Pivot class
and then call the PivotData method with the required parameters.
The PivotData() method returns the DataTable which can
directly be used as the DataSource of the GridView. id="preimg2" src="https://img8.php1.cn/3cdc5/125e8/978/fea424fcd874c583.gif"
>
Collapse | Copy
Code
Pivot pvt = new Pivot(dt);
grdPivot.DataSource = pvt.PivotData("Designation", "CTC",
AggregateFunction.Max, "Company", "Department", "Year");
grdPivot.DataBind();
"_Data" folder of the root folder of sample application.Merge GridView Header Cells
MergeHeader function is created to merge the header cells to
provide a simplified look.id="preimg3" src="https://img8.php1.cn/3cdc5/125e8/978/fea424fcd874c583.gif"
>
Collapse | Copy
Code
{
for (int iCount = 1; iCount <= PivotLevel; iCount++)
{
GridViewRow oGridViewRow = new GridViewRow(0, 0,
DataControlRowType.Header, DataControlRowState.Insert);
var Header = (row.Cells.Cast
.Select(x => GetHeaderText(x.Text, iCount, PivotLevel)))
.GroupBy(x => x);
foreach (var v in Header)
{
TableHeaderCell cell = new TableHeaderCell();
cell.Text = v.Key.Substring(v.Key.LastIndexOf(_Separator) + 1);
cell.ColumnSpan = v.Count();
oGridViewRow.Cells.Add(cell);
}
gv.Controls[0].Controls.AddAt(row.RowIndex, oGridViewRow);
}
row.Visible = false;
}PivotLevel here is the number of columns on which the pivot is
done.Header gets all the column values in an array, groups the
repeated values returned by the GetHeaderText() function, sets the ColumnSpan property of the newly created cell according to the
number of repeated HeaderText, and then adds the cell to the GridViewRow. Finally, add the GridViewRow to the GridView.GetHeaderText() function returns the header text based on
the PivotLevel.ColumnFields,
namely, Company, Department, and Year. The result header of the GridView will initially have a header like Company.Department.Year
for a PivotLevel 1. GetHeaderText() will return
Company. For a PivotLevel 2, GetHeaderText() will
return Company.Department. For a PivotLevel 3, GetHeaderText() will return Company.Department.Year, and so
on... Merge GridView Row Header Cells
we are simply merging the cells with same text.id="preimg4" src="https://img8.php1.cn/3cdc5/125e8/978/fea424fcd874c583.gif"
>
Collapse | Copy
Code
{
for (int rowIndex = gv.Rows.Count - 2; rowIndex >= 0; rowIndex--)
{
GridViewRow row = gv.Rows[rowIndex];
GridViewRow prevRow = gv.Rows[rowIndex + 1];
for (int colIndex = 0; colIndex
if (row.Cells[colIndex].Text == prevRow.Cells[colIndex].Text)
{
row.Cells[colIndex].RowSpan = (prevRow.Cells[colIndex].RowSpan <2) ? 2 : prevRow.Cells[colIndex].RowSpan + 1;
prevRow.Cells[colIndex].Visible = false;
}
}
}
}
the row header cells from bottom to top, compare the text with previous
corresponding row cell, increases the row span by 1 if same and hide the
previous corresponding row.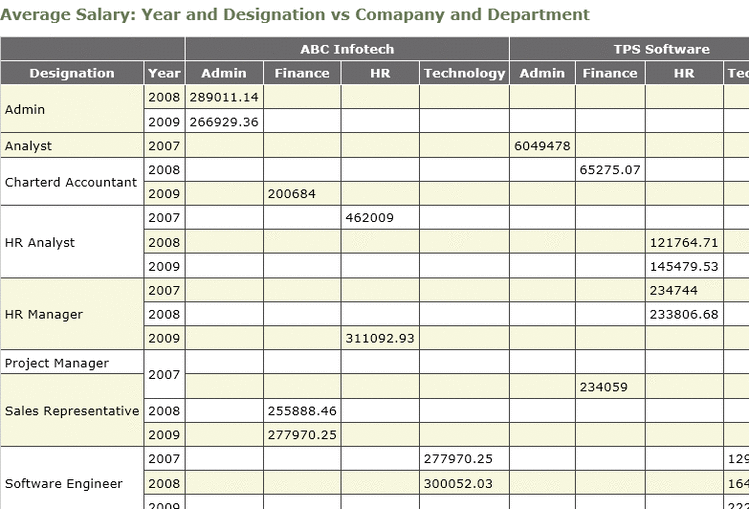
GridView containing the third
level pivoted data: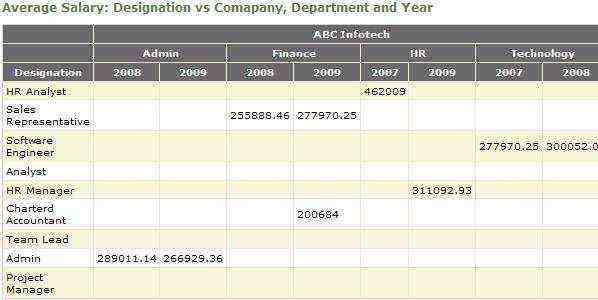 >
>Points of Interest
DataTable, the code will also help you
to merge the header cells in the desired format in GridView.
Moreover, you may have a deeper look into PivotData method to know
how you can search or filter data in DataTable suing linq. Apart from this, MergeRows method acts as a sample to merge rows in a GridView. For
beginners, the ExcelLayer.GetDataTable() method will be a sample to
get the data from the Excel Sheet.DataTable: http://www.codeproject.com/KB/recipes/CsharpPivotTable.aspx.Future Consideration
DataTable. The
code will be enhanced to pivot any object derived from an IListSource or ICollection.


![[译]技术公司十年经验的职场生涯回顾](https://img8.php1.cn/3cdc5/24912/711/b6574f3292f9dc00.png)

 京公网安备 11010802041100号