通过之前的文章,我们做到了Grafana的安装部署和初期的设置,没有了解过的同学可以参考下面的文章链接
https://blog.csdn.net/diandianxiyu_geek/article/details/97013330
https://blog.csdn.net/diandianxiyu_geek/article/details/96577082
接下来要做的是数据可视化的一个应用,nginx访问文件的监控,输出图表。
如果你没有进行额外的配置,那么你的nginx日志是这样的
101.254.141.164 - - [19/Jul/2019:11:22:03 +0800] "GET /online/cart/info HTTP/1.1" 200 120 "https://servicewechat.com/wx855bd11a98860d4e/devtools/page-frame.html" "Mozilla/5.0 (iPhone; CPU iPhone OS 10_2 like Mac OS X) AppleWebKit/602.3.12 (KHTML, like Gecko) Mobile/14C92 Safari/601.1 wechatdevtools/1.02.1905151 MicroMessenger/6.7.3 Language/zh_CN webview/"
101.254.141.164 - - [19/Jul/2019:11:22:03 +0800] "GET /online/item/new?page=1&count=99 HTTP/1.1" 200 469 "https://servicewechat.com/wx855bd11a98860d4e/devtools/page-frame.html" "Mozilla/5.0 (iPhone; CPU iPhone OS 10_2 like Mac OS X) AppleWebKit/602.3.12 (KHTML, like Gecko) Mobile/14C92 Safari/601.1 wechatdevtools/1.02.1905151 MicroMessenger/6.7.3 Language/zh_CN webview/"
101.254.141.164 - - [19/Jul/2019:11:22:03 +0800] "GET /online/item/list?page=1&count=10 HTTP/1.1" 200 618 "https://servicewechat.com/wx855bd11a98860d4e/devtools/page-frame.html" "Mozilla/5.0 (iPhone; CPU iPhone OS 10_2 like Mac OS X) AppleWebKit/602.3.12 (KHTML, like Gecko) Mobile/14C92 Safari/601.1 wechatdevtools/1.02.1905151 MicroMessenger/6.7.3 Language/zh_CN webview/“
接下来修改配置文件,让日志记录更多信息
找到你的nginx
[root@VM_0_15_centos conf]# whereis  nginx
nginx: /usr/local/nginx /usr/local/nginx/sbin/nginx
找到配置文件
[root@VM_0_15_centos conf]# cd /usr/local/nginx/conf
[root@VM_0_15_centos conf]# ls
fastcgi.conf          fastcgi_params          koi-utf  mime.types          nginx.conf     nginx.conf.default  scgi_params          uwsgi_params          vhost
fastcgi.conf.default  fastcgi_params.default  koi-win  mime.types.default  nginx.conf_bk  proxy.conf          scgi_params.default  uwsgi_params.default  win-utf
[root@VM_0_15_centos conf]# cat nginx.conf
user www www;
worker_processes auto;
error_log /data/wwwlogs/error_nginx.log crit;
pid /var/run/nginx.pid;
worker_rlimit_nofile 51200;
events {
  use epoll;
  worker_connections 51200;
  multi_accept on;
}
http {
  include mime.types;
  default_type application/octet-stream;
  server_names_hash_bucket_size 128;
  client_header_buffer_size 32k;
  large_client_header_buffers 4 32k;
  client_max_body_size 1024m;
  client_body_buffer_size 10m;
  sendfile on;
  tcp_nopush on;
  keepalive_timeout 120;
  server_tokens off;
  tcp_nodelay on;
  fastcgi_connect_timeout 300;
  fastcgi_send_timeout 300;
  fastcgi_read_timeout 300;
  fastcgi_buffer_size 64k;
  fastcgi_buffers 4 64k;
  fastcgi_busy_buffers_size 128k;
  fastcgi_temp_file_write_size 128k;
  fastcgi_intercept_errors on;
 #注意这部分是新增的,日志配置
  log_format  main  '$remote_addr - $remote_user [$time_local] "$request" $http_host '
                        '$status $request_length $body_bytes_sent "$http_referer" '
                        '"$http_user_agent"  $request_time $upstream_response_time';
  #Gzip Compression
  gzip on;
  gzip_buffers 16 8k;
  gzip_comp_level 6;
  gzip_http_version 1.1;
  gzip_min_length 256;
  gzip_proxied any;
  gzip_vary on;
  gzip_types
    text/xml application/xml application/atom+xml application/rss+xml application/xhtml+xml image/svg+xml
    text/Javascript application/Javascript application/x-Javascript
    text/x-json application/json application/x-web-app-manifest+json
    text/css text/plain text/x-component
    font/opentype application/x-font-ttf application/vnd.ms-fontobject
    image/x-icon;
  gzip_disable "MSIE [1-6].(?!.*SV1)";
  ##If you have a lot of static files to serve through Nginx then caching of the files' metadata (not the actual files' contents) can save some latency.
  #open_file_cache max=1000 inactive=20s;
  #open_file_cache_valid 30s;
  #open_file_cache_min_uses 2;
  #open_file_cache_errors on;
######################## default ############################
  server {
    listen 80;
    server_name _;
    access_log /data/wwwlogs/access_nginx.log combined;
    root /data/wwwroot/default;
    index index.html index.htm index.php;
    #error_page 404 /404.html;
    #error_page 502 /502.html;
    location /nginx_status {
      stub_status on;
      access_log off;
      allow 127.0.0.1;
      deny all;
    }
    location ~ [^/].php(/|$) {
      #fastcgi_pass remote_php_ip:9000;
      fastcgi_pass unix:/dev/shm/php-cgi.sock;
      fastcgi_index index.php;
      include fastcgi.conf;
    }
    location ~ .*.(gif|jpg|jpeg|png|bmp|swf|flv|mp4|ico)$ {
      expires 30d;
      access_log off;
    }
    location ~ .*.(js|css)?$ {
      expires 7d;
      access_log off;
    }
    location ~ ^/(.user.ini|.ht|.git|.svn|.project|LICENSE|README.md) {
      deny all;
    }
  }
########################## vhost #############################
  include vhost/*.conf;
}
在上面的配置文件中我已经把日志配置加了进去,为了方便辨认再贴一遍
在http中添加对应日志配置->
 log_format  main  '$remote_addr - $remote_user [$time_local] "$request" $http_host '
                        '$status $request_length $body_bytes_sent "$http_referer" '
                        '"$http_user_agent"  $request_time $upstream_response_time’;
上面的配置的意思是增加一个main的日志配置
接下来将nginx.conf的server中的access_log /data/wwwlogs/access_nginx.log combined;
combined 替换为main,combined为nginx内置的不需要配置的默认文件格式。
vhost里的所有文件也要进行替换。
重启nginx
再查看日志,就变成了
101.254.141.164 - - [19/Jul/2019:11:38:36 +0800] "GET /online/item/list?page=1&count=10 HTTP/1.1" api4621d373.henibox.com 200 587 619 "https://servicewechat.com/wx855bd11a98860d4e/0/page-frame.html" "Mozilla/5.0 (Linux; Android 8.0.0; MIX Build/OPR1.170623.032; wv) AppleWebKit/537.36 (KHTML, like Gecko) Version/4.0 Chrome/68.0.3440.91 Mobile Safari/537.36 MicroMessenger/7.0.5.1440(0x27000537) Process/appbrand2 NetType/WIFI Language/zh_CN"  0.351 0.351
101.254.141.164 - - [19/Jul/2019:11:38:36 +0800] "GET /online/pick/list?page=1&count=4 HTTP/1.1" api4621d373.henibox.com 200 586 634 "https://servicewechat.com/wx855bd11a98860d4e/0/page-frame.html" "Mozilla/5.0 (Linux; Android 8.0.0; MIX Build/OPR1.170623.032; wv) AppleWebKit/537.36 (KHTML, like Gecko) Version/4.0 Chrome/68.0.3440.91 Mobile Safari/537.36 MicroMessenger/7.0.5.1440(0x27000537) Process/appbrand2 NetType/WIFI Language/zh_CN"  0.389 0.389
为了防止日志系统识别格式问题,可以将之前的日志文件转移到其他文件夹作为备份
在阿里云日志系统中添加一个项目,在项目中添加一个Logstore,然后接入配置向导

选择nginx访问日志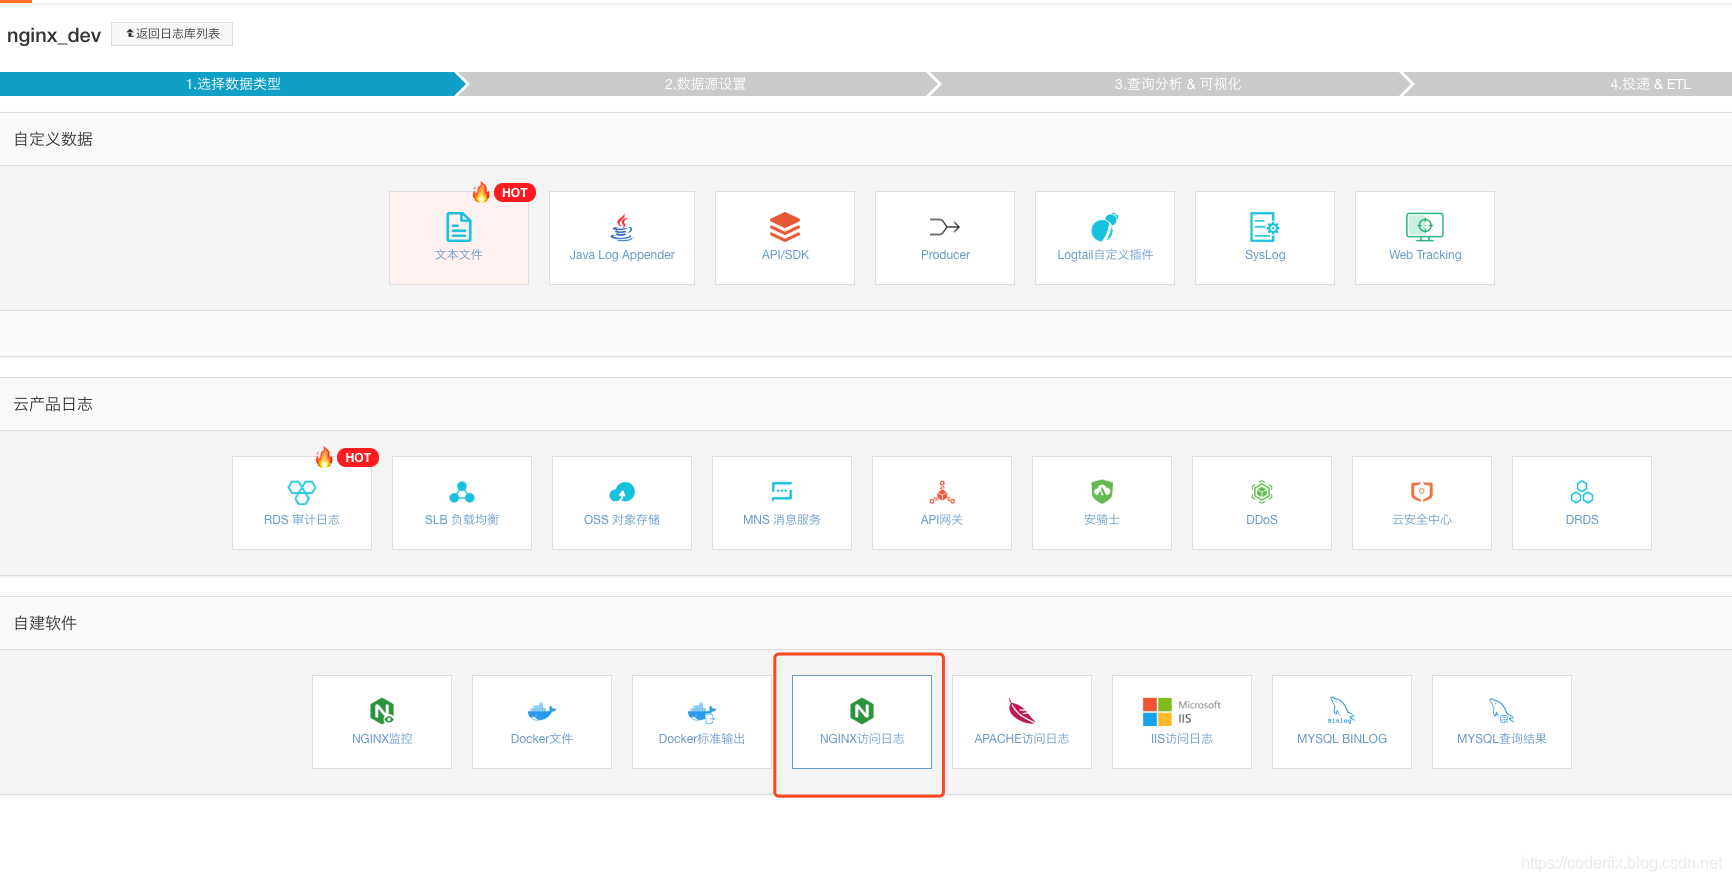
填写的日志格式就是我们之前修改的日志格式
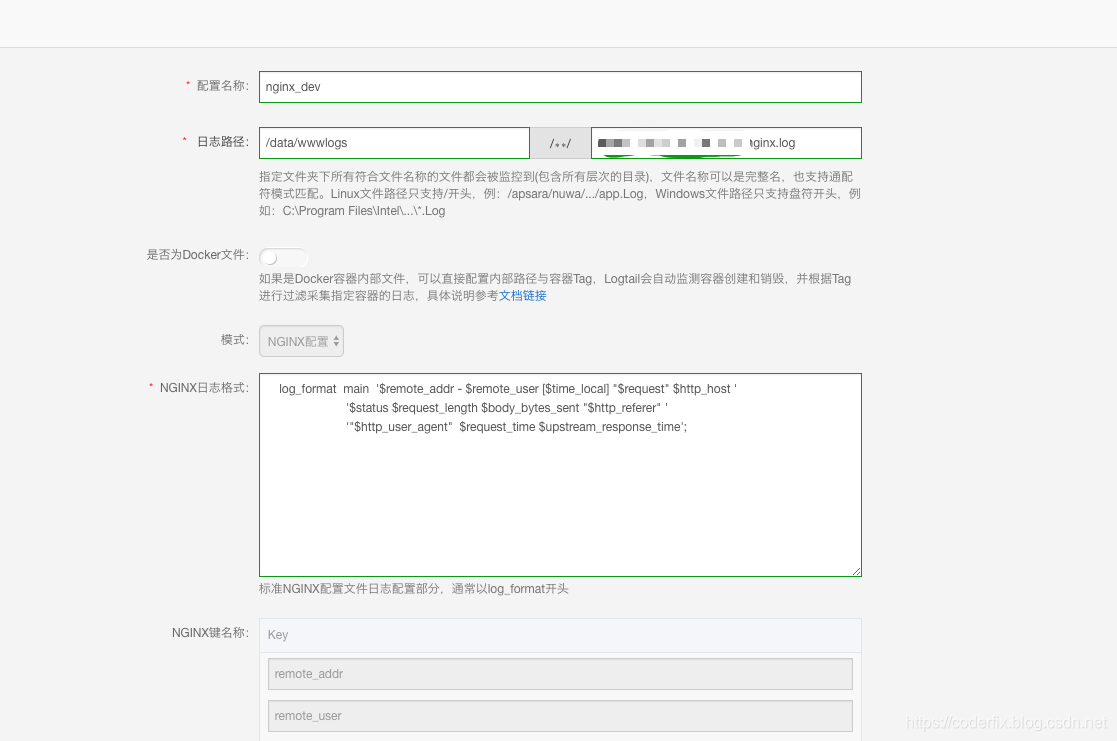
选择需要应用的机器,这里作为测试选择测试机器

下一步就会自动识别文本,匹配对应的字段,并增加索引进行统计

到这一步,在阿里云日志服务的部分就完成了。
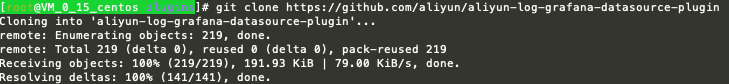
首先接入数据源,安装插件
cd /var/lib/grafana/plugins
git clone https://github.com/aliyun/aliyun-log-grafana-datasource-plugin
查看新增一个数据源

下一步开始配置

然后配置变量,配置变量用于在仪表盘页面公共选择时间段
我们用简单粗暴的引入方式,先直接引入阿里云官方给出的demo
{
"annotations": {
"list": []
},
"description": "日志服务demo",
"editable": true,
"gnetId": null,
"graphTooltip": 0,
"hideControls": false,
"id": 2,
"links": [],
"rows": [
{
"collapse": false,
"height": "250px",
"panels": [
{
"aliasColors": {},
"bars": false,
"dashLength": 10,
"dashes": false,
"datasource": "logservice",
"fill": 1,
"id": 3,
"legend": {
"avg": false,
"current": false,
"max": false,
"min": false,
"rightSide": false,
"show": true,
"total": false,
"values": false
},
"lines": true,
"linewidth": 1,
"links": [],
"nullPointMode": "null",
"percentage": false,
"pointradius": 5,
"points": false,
"renderer": "flot",
"seriesOverrides": [
{
"alias": "pv",
"yaxis": 2
}
],
"spaceLength": 10,
"span": 3,
"stack": false,
"steppedLine": false,
"targets": [
{
"bucketAggs": [],
"query": "$hostname| select approx_distinct(remote_addr) as uv ,count(1) as pv , __time__ - __time__%$$myinterval as time group by __time__ - __time__%$$myinterval order by time limit 1000",
"refId": "A",
"target": "uv,pv",
"type": "timeserie",
"xcol": "time",
"ycol": "uv,pv"
}
],
"thresholds": [],
"timeFrom": null,
"timeShift": null,
"title": "UV & PV",
"tooltip": {
"shared": true,
"sort": 0,
"value_type": "individual"
},
"type": "graph",
"xaxis": {
"buckets": null,
"mode": "time",
"name": null,
"show": true,
"values": []
},
"yaxes": [
{
"decimals": null,
"format": "short",
"label": null,
"logBase": 1,
"max": null,
"min": null,
"show": true
},
{
"decimals": null,
"format": "short",
"label": "",
"logBase": 1,
"max": null,
"min": null,
"show": true
}
]
},
{
"aliasColors": {},
"bars": false,
"dashLength": 10,
"dashes": false,
"datasource": "logservice",
"fill": 1,
"id": 6,
"legend": {
"avg": false,
"current": false,
"max": false,
"min": false,
"show": true,
"total": false,
"values": false
},
"lines": true,
"linewidth": 1,
"links": [],
"nullPointMode": "null",
"percentage": false,
"pointradius": 5,
"points": false,
"renderer": "flot",
"seriesOverrides": [],
"spaceLength": 10,
"span": 3,
"stack": false,
"steppedLine": false,
"targets": [
{
"bucketAggs": [],
"query": "$hostname | select sum(body_byte_sent) as net_out, sum(request_length) as net_in ,__time__ - __time__ % $$myinterval as time group by __time__ - __time__ % $$myinterval limit 10000",
"refId": "A",
"target": "net_in,net_out",
"type": "timeserie",
"xcol": "time",
"ycol": "net_in,net_out"
}
],
"thresholds": [],
"timeFrom": null,
"timeShift": null,
"title": "入网、出网带宽",
"tooltip": {
"shared": true,
"sort": 0,
"value_type": "individual"
},
"type": "graph",
"xaxis": {
"buckets": null,
"mode": "time",
"name": null,
"show": true,
"values": []
},
"yaxes": [
{
"format": "short",
"label": null,
"logBase": 1,
"max": null,
"min": null,
"show": true
},
{
"format": "short",
"label": null,
"logBase": 1,
"max": null,
"min": null,
"show": true
}
]
},
{
"columns": [],
"datasource": "logservice",
"fontSize": "100%",
"id": 15,
"links": [],
"pageSize": null,
"scroll": true,
"showHeader": true,
"sort": {
"col": 2,
"desc": true
},
"span": 3,
"styles": [
{
"alias": "Time",
"dateFormat": "YYYY-MM-DD HH:mm:ss",
"pattern": "Time",
"type": "hidden"
},
{
"alias": "",
"colorMode": null,
"colors": [
"rgba(245, 54, 54, 0.9)",
"rgba(237, 129, 40, 0.89)",
"rgba(50, 172, 45, 0.97)"
],
"decimals": 2,
"pattern": "/.*/",
"thresholds": [],
"type": "number",
"unit": "short"
}
],
"targets": [
{
"bucketAggs": [],
"query": "* | select diff[1] as today, diff[2] as yestoday, concat( cast( round((diff[3] - 1)*100,2) as varchar),'%') as growth from(select compare(pv, 86400) as diff from(select count(1) as pv from log))",
"refId": "A",
"target": "today,yestoday,growth",
"type": "timeserie",
"xcol": "table",
"ycol": "today,yestoday,growth"
}
],
"title": "环比比较",
"transform": "timeseries_to_columns",
"type": "table"
},
{
"cacheTimeout": null,
"colorBackground": false,
"colorValue": false,
"colors": [
"rgba(245, 54, 54, 0.9)",
"rgba(237, 129, 40, 0.89)",
"rgba(50, 172, 45, 0.97)"
],
"datasource": "logservice",
"format": "none",
"gauge": {
"maxValue": 100,
"minValue": 0,
"show": false,
"thresholdLabels": false,
"thresholdMarkers": true
},
"id": 17,
"interval": null,
"links": [],
"mappingType": 1,
"mappingTypes": [
{
"name": "value to text",
"value": 1
},
{
"name": "range to text",
"value": 2
}
],
"maxDataPoints": 100,
"nullPointMode": "connected",
"nullText": null,
"postfix": "",
"postfixFontSize": "50%",
"prefix": "",
"prefixFontSize": "50%",
"rangeMaps": [
{
"from": "null",
"text": "N/A",
"to": "null"
}
],
"span": 3,
"sparkline": {
"fillColor": "rgba(31, 118, 189, 0.18)",
"full": false,
"lineColor": "rgb(31, 120, 193)",
"show": false
},
"tableColumn": "",
"targets": [
{
"bucketAggs": [],
"query": "* | select count(1) as total_pv",
"refId": "A",
"target": "total_pv",
"type": "timeserie",
"ycol": "total_pv"
}
],
"thresholds": "",
"title": "总pv",
"type": "singlestat",
"valueFontSize": "80%",
"valueMaps": [
{
"op": "=",
"text": "N/A",
"value": "null"
}
],
"valueName": "avg"
}
],
"repeat": null,
"repeatIteration": null,
"repeatRowId": null,
"showTitle": false,
"title": "Dashboard Row",
"titleSize": "h6"
},
{
"collapse": false,
"height": 207,
"panels": [
{
"aliasColors": {},
"cacheTimeout": null,
"combine": {
"label": "Others",
"threshold": 0
},
"datasource": "logservice",
"fontSize": "80%",
"format": "short",
"id": 2,
"interval": null,
"legend": {
"show": true,
"values": true
},
"legendType": "Under graph",
"links": [],
"maxDataPoints": 3,
"nullPointMode": "connected",
"pieType": "pie",
"span": 2,
"strokeWidth": 1,
"targets": [
{
"bucketAggs": [],
"query": "$hostname | select count(1) as pv ,method group by method",
"refId": "A",
"target": "method,pv",
"type": "timeserie",
"xcol": "pie",
"ycol": "method,pv"
}
],
"title": "HTTP方法汇总",
"type": "grafana-piechart-panel",
"valueName": "current"
},
{
"aliasColors": {},
"cacheTimeout": null,
"combine": {
"label": "Others",
"threshold": 0
},
"datasource": "logservice",
"fontSize": "80%",
"format": "short",
"id": 5,
"interval": null,
"legend": {
"show": true,
"values": true
},
"legendType": "Under graph",
"links": [],
"maxDataPoints": 3,
"nullPointMode": "connected",
"pieType": "pie",
"span": 2,
"strokeWidth": 1,
"targets": [
{
"bucketAggs": [],
"query": "$hostname | select count(1) as pv ,status group by status",
"refId": "A",
"target": "status,pv",
"type": "timeserie",
"xcol": "pie",
"ycol": "status,pv"
}
],
"title": "HTTP状态码",
"type": "grafana-piechart-panel",
"valueName": "current"
},
{
"aliasColors": {},
"cacheTimeout": null,
"combine": {
"label": "Others",
"threshold": 0
},
"datasource": "logservice",
"fontSize": "80%",
"format": "short",
"id": 8,
"interval": null,
"legend": {
"show": true,
"values": true
},
"legendType": "Under graph",
"links": [],
"maxDataPoints": 3,
"nullPointMode": "connected",
"pieType": "pie",
"span": 4,
"strokeWidth": 1,
"targets": [
{
"bucketAggs": [],
"query": "$hostname | select count(1) as pv , http_referer group by http_referer order by pv desc",
"refId": "A",
"target": "referer,pv",
"type": "timeserie",
"xcol": "pie",
"ycol": "http_referer,pv"
}
],
"title": "Top来源域名",
"type": "grafana-piechart-panel",
"valueName": "current"
},
{
"aliasColors": {},
"cacheTimeout": null,
"combine": {
"label": "Others",
"threshold": 0
},
"datasource": "logservice",
"fontSize": "80%",
"format": "short",
"id": 11,
"interval": null,
"legend": {
"show": true,
"values": true
},
"legendType": "Under graph",
"links": [],
"maxDataPoints": 3,
"nullPointMode": "connected",
"pieType": "pie",
"span": 4,
"strokeWidth": 1,
"targets": [
{
"bucketAggs": [],
"query": "$hostname | select count(1) as pv, case when http_user_agent like '%Android%' then 'Android' when http_user_agent like '%iPhone%' then 'iOS' else 'unKnown' end as http_user_agent group by case when http_user_agent like '%Android%' then 'Android' when http_user_agent like '%iPhone%' then 'iOS' else 'unKnown' end order by pv desc limit 10",
"refId": "A",
"target": "http_user_agent,pv",
"type": "timeserie",
"xcol": "pie",
"ycol": "http_user_agent,pv"
}
],
"title": "客户端分布",
"type": "grafana-piechart-panel",
"valueName": "current"
}
],
"repeat": null,
"repeatIteration": null,
"repeatRowId": null,
"showTitle": false,
"title": "Dashboard Row",
"titleSize": "h6"
},
{
"collapse": false,
"height": 362,
"panels": [
{
"columns": [],
"datasource": "logservice",
"fontSize": "100%",
"id": 9,
"links": [],
"pageSize": null,
"scroll": true,
"showHeader": true,
"sort": {
"col": 0,
"desc": true
},
"span": 3,
"styles": [
{
"alias": "Time",
"dateFormat": "YYYY-MM-DD HH:mm:ss",
"pattern": "Time",
"type": "date"
},
{
"alias": "",
"colorMode": null,
"colors": [
"rgba(245, 54, 54, 0.9)",
"rgba(237, 129, 40, 0.89)",
"rgba(50, 172, 45, 0.97)"
],
"decimals": 2,
"pattern": "/.*/",
"thresholds": [],
"type": "number",
"unit": "short"
}
],
"targets": [
{
"bucketAggs": [],
"query": "$hostname | select uri as top_latency_url ,request_time order by request_time desc limit 10",
"refId": "A",
"target": "top_latency_url,request_time",
"type": "timeserie",
"ycol": "top_latency_url,request_time"
}
],
"title": "延时最高的页面",
"transform": "timeseries_to_columns",
"type": "table"
},
{
"columns": [],
"datasource": "logservice",
"fontSize": "100%",
"id": 4,
"links": [],
"pageSize": null,
"scroll": true,
"showHeader": true,
"sort": {
"col": 0,
"desc": false
},
"span": 4,
"styles": [
{
"alias": "Time",
"dateFormat": "YYYY-MM-DD HH:mm:ss",
"pattern": "Time",
"type": "date"
},
{
"alias": "",
"colorMode": null,
"colors": [
"rgba(245, 54, 54, 0.9)",
"rgba(237, 129, 40, 0.89)",
"rgba(50, 172, 45, 0.97)"
],
"decimals": 2,
"pattern": "/.*/",
"thresholds": [],
"type": "number",
"unit": "short"
}
],
"targets": [
{
"bucketAggs": [],
"query": "$hostname | select count(1) as pv, split_part(uri,'?',1) as path group by split_part(uri,'?',1) order by pv desc limit 20",
"refId": "A",
"target": "path,pv",
"type": "timeserie",
"ycol": "path,pv"
}
],
"title": "热门页面",
"transform": "timeseries_to_columns",
"type": "table"
},
{
"columns": [],
"datasource": "logservice",
"fontSize": "100%",
"id": 10,
"links": [],
"pageSize": null,
"scroll": true,
"showHeader": true,
"sort": {
"col": 0,
"desc": false
},
"span": 5,
"styles": [
{
"alias": "Time",
"dateFormat": "YYYY-MM-DD HH:mm:ss",
"pattern": "Time",
"type": "date"
},
{
"alias": "",
"colorMode": null,
"colors": [
"rgba(245, 54, 54, 0.9)",
"rgba(237, 129, 40, 0.89)",
"rgba(50, 172, 45, 0.97)"
],
"decimals": 2,
"pattern": "/.*/",
"thresholds": [],
"type": "number",
"unit": "short"
}
],
"targets": [
{
"bucketAggs": [],
"query": "$hostname not status:200| select count(1) as pv , uri group by uri order by pv desc",
"refId": "A",
"target": "url,pv",
"type": "timeserie",
"ycol": "url,pv"
}
],
"title": "非200请求TOP页面",
"transform": "timeseries_to_columns",
"type": "table"
}
],
"repeat": null,
"repeatIteration": null,
"repeatRowId": null,
"showTitle": false,
"title": "Dashboard Row",
"titleSize": "h6"
},
{
"collapse": false,
"height": 282,
"panels": [
{
"aliasColors": {},
"bars": false,
"dashLength": 10,
"dashes": false,
"datasource": "logservice",
"fill": 1,
"id": 7,
"legend": {
"avg": false,
"current": false,
"max": false,
"min": false,
"show": true,
"total": false,
"values": false
},
"lines": true,
"linewidth": 1,
"links": [],
"nullPointMode": "null",
"percentage": false,
"pointradius": 5,
"points": false,
"renderer": "flot",
"seriesOverrides": [],
"spaceLength": 10,
"span": 3,
"stack": false,
"steppedLine": false,
"targets": [
{
"bucketAggs": [],
"query": "$hostname | select avg(request_time) as response_time, avg(upstream_response_time) as upstream_response_time ,__time__ - __time__ % $$myinterval as time group by __time__ - __time__ % $$myinterval limit 10000",
"refId": "A",
"target": "upstream_response_time,response_time",
"type": "timeserie",
"xcol": "time",
"ycol": "upstream_response_time,response_time"
}
],
"thresholds": [],
"timeFrom": null,
"timeShift": null,
"title": "前端平均延时和后端平均延时",
"tooltip": {
"shared": true,
"sort": 0,
"value_type": "individual"
},
"type": "graph",
"xaxis": {
"buckets": null,
"mode": "time",
"name": null,
"show": true,
"values": []
},
"yaxes": [
{
"format": "short",
"label": null,
"logBase": 1,
"max": null,
"min": null,
"show": true
},
{
"format": "short",
"label": null,
"logBase": 1,
"max": null,
"min": null,
"show": true
}
]
},
{
"aliasColors": {},
"cacheTimeout": null,
"combine": {
"label": "Others",
"threshold": 0
},
"datasource": "logservice",
"fontSize": "80%",
"format": "short",
"id": 12,
"interval": null,
"legend": {
"show": true,
"values": true
},
"legendType": "Under graph",
"links": [],
"maxDataPoints": 3,
"nullPointMode": "connected",
"pieType": "pie",
"span": 5,
"strokeWidth": 1,
"targets": [
{
"bucketAggs": [],
"query": "*| select ip_to_province(remote_addr) as province, count(1) as pv group by province order by pv desc limit 10",
"refId": "A",
"target": "province,pv",
"type": "timeserie",
"xcol": "pie",
"ycol": "province,pv"
}
],
"title": "不同省份PV",
"type": "grafana-piechart-panel",
"valueName": "current"
},
{
"aliasColors": {},
"cacheTimeout": null,
"combine": {
"label": "Others",
"threshold": 0
},
"datasource": "logservice",
"fontSize": "80%",
"format": "short",
"id": 13,
"interval": null,
"legend": {
"show": true,
"values": true
},
"legendType": "Under graph",
"links": [],
"maxDataPoints": 3,
"nullPointMode": "connected",
"pieType": "pie",
"span": 4,
"strokeWidth": 1,
"targets": [
{
"bucketAggs": [],
"query": "*| select ip_to_provider(remote_addr) as vendor, count(1) as pv group by vendor order by pv desc limit 10",
"refId": "A",
"type": "timeserie",
"xcol": "pie",
"ycol": "vendor,pv"
}
],
"title": "网络供应商",
"type": "grafana-piechart-panel",
"valueName": "current"
}
],
"repeat": null,
"repeatIteration": null,
"repeatRowId": null,
"showTitle": false,
"title": "Dashboard Row",
"titleSize": "h6"
},
{
"collapse": false,
"height": 250,
"panels": [
{
"circleMaxSize": 30,
"circleMinSize": 2,
"colors": [
"rgba(245, 54, 54, 0.9)",
"rgba(237, 129, 40, 0.89)",
"rgba(50, 172, 45, 0.97)"
],
"datasource": "logservice",
"decimals": 0,
"esMetric": "Count",
"hideEmpty": false,
"hideZero": false,
"id": 14,
"initialZoom": 1,
"locationData": "countries",
"mapCenter": "(0°, 0°)",
"mapCenterLatitude": 0,
"mapCenterLongitude": 0,
"maxDataPoints": 1,
"showLegend": true,
"span": 6,
"stickyLabels": false,
"targets": [
{
"bucketAggs": [],
"query": "* | select count(1) as pv , ip_to_country_code(remote_addr) as country group by country",
"refId": "A",
"type": "timeserie",
"xcol": "bar",
"ycol": "country,pv"
}
],
"thresholds": "0,10",
"title": "Panel Title",
"type": "grafana-worldmap-panel",
"unitPlural": "",
"unitSingle": "",
"valueName": "total"
},
{
"cards": {
"cardPadding": null,
"cardRound": null
},
"color": {
"cardColor": "#b4ff00",
"colorScale": "sqrt",
"colorScheme": "interpolateOranges",
"exponent": 0.5,
"mode": "spectrum"
},
"dataFormat": "timeseries",
"datasource": "logservice",
"heatmap": {},
"highlightCards": true,
"id": 18,
"legend": {
"show": false
},
"links": [],
"span": 6,
"targets": [
{
"bucketAggs": [],
"query": "* | select __time__ - __time__ % $$myinterval as t, method,count(1) as pv group by t, method order by t limit 10000",
"refId": "A",
"target": "method#:#pv",
"type": "timeserie",
"xcol": "t",
"ycol": "method#:#pv"
}
],
"title": "热力图演示,method热力图",
"tooltip": {
"show": true,
"showHistogram": false
},
"type": "heatmap",
"xAxis": {
"show": true
},
"xBucketNumber": null,
"xBucketSize": null,
"yAxis": {
"decimals": null,
"format": "short",
"logBase": 1,
"max": null,
"min": null,
"show": true,
"splitFactor": null
},
"yBucketNumber": null,
"yBucketSize": null
}
],
"repeat": null,
"repeatIteration": null,
"repeatRowId": null,
"showTitle": false,
"title": "Dashboard Row",
"titleSize": "h6"
},
{
"collapse": false,
"height": 250,
"panels": [
{
"content": "# 查看配置nn在本页面顶端,点击“share dashboard” 按钮 -> Export 。 导出为json文件,该配置可以导入您的dashboard。",
"id": 16,
"links": [],
"mode": "markdown",
"span": 6,
"title": "",
"type": "text"
},
{
"aliasColors": {},
"bars": true,
"dashLength": 10,
"dashes": false,
"datasource": "logservice",
"fill": 1,
"id": 19,
"legend": {
"avg": false,
"current": false,
"max": false,
"min": false,
"show": true,
"total": false,
"values": false
},
"lines": false,
"linewidth": 1,
"links": [],
"nullPointMode": "null",
"percentage": false,
"pointradius": 5,
"points": false,
"renderer": "flot",
"seriesOverrides": [],
"spaceLength": 10,
"span": 6,
"stack": true,
"steppedLine": false,
"targets": [
{
"bucketAggs": [],
"query": "* | select __time__ - __time__ % $$myinterval as t, count(1) as pv , method group by t , method limit 10000",
"refId": "A",
"target": "method#:#pv",
"type": "timeserie",
"xcol": "t",
"ycol": "method#:#pv"
}
],
"thresholds": [],
"timeFrom": null,
"timeShift": null,
"title": "各个Method堆叠图",
"tooltip": {
"shared": true,
"sort": 0,
"value_type": "individual"
},
"type": "graph",
"xaxis": {
"buckets": null,
"mode": "time",
"name": null,
"show": true,
"values": []
},
"yaxes": [
{
"format": "short",
"label": null,
"logBase": 1,
"max": null,
"min": null,
"show": true
},
{
"format": "short",
"label": null,
"logBase": 1,
"max": null,
"min": null,
"show": true
}
]
}
],
"repeat": null,
"repeatIteration": null,
"repeatRowId": null,
"showTitle": false,
"title": "Dashboard Row",
"titleSize": "h6"
}
],
"schemaVersion": 14,
"style": "dark",
"tags": [],
"templating": {
"list": [
{
"auto": true,
"auto_count": 30,
"auto_min": "10s",
"current": {
"text": "30m",
"value": "30m"
},
"hide": 0,
"label": "time interval",
"name": "myinterval",
"options": [
{
"selected": false,
"text": "auto",
"value": "$__auto_interval"
},
{
"selected": false,
"text": "1m",
"value": "1m"
},
{
"selected": false,
"text": "10m",
"value": "10m"
},
{
"selected": true,
"text": "30m",
"value": "30m"
},
{
"selected": false,
"text": "1h",
"value": "1h"
},
{
"selected": false,
"text": "6h",
"value": "6h"
},
{
"selected": false,
"text": "12h",
"value": "12h"
},
{
"selected": false,
"text": "1d",
"value": "1d"
},
{
"selected": false,
"text": "7d",
"value": "7d"
},
{
"selected": false,
"text": "14d",
"value": "14d"
},
{
"selected": false,
"text": "30d",
"value": "30d"
}
],
"query": "1m,10m,30m,1h,6h,12h,1d,7d,14d,30d",
"refresh": 2,
"type": "interval"
},
{
"allValue": null,
"current": {
"text": "*",
"value": "*"
},
"hide": 0,
"includeAll": false,
"label": "域名",
"multi": false,
"name": "hostname",
"options": [
{
"selected": true,
"text": "*",
"value": "*"
},
{
"selected": false,
"text": "www.host.com",
"value": "www.host.com"
},
{
"selected": false,
"text": "www.host0.com",
"value": "www.host0.com"
},
{
"selected": false,
"text": "www.host1.com",
"value": "www.host1.com"
}
],
"query": "*,www.host.com,www.host0.com,www.host1.com",
"type": "custom"
}
]
},
"time": {
"from": "now-24h",
"to": "now"
},
"timepicker": {
"refresh_intervals": [
"5s",
"10s",
"30s",
"1m",
"5m",
"15m",
"30m",
"1h",
"2h",
"1d"
],
"time_options": [
"5m",
"15m",
"1h",
"6h",
"12h",
"24h",
"2d",
"7d",
"30d"
]
},
"timezone": "",
"title": "Nginx访问统计",
"version": 79
}
注意上面的json文件,千万不要直接复制,这里需要修改的地方有两个,
一个是数据源,一定要改成自己前面配置的数据源的名称,不能用这个默认的
还有就是变量的域名部分,在这里直接改成自己的域名,就不用再去配置里的变量去改了
注意,由于这个官方的版本比较老,配置之后还存在字段兼容性的问题,需要按下面的进行修改
我们可以在仪表盘的配置界面直接修改json文件
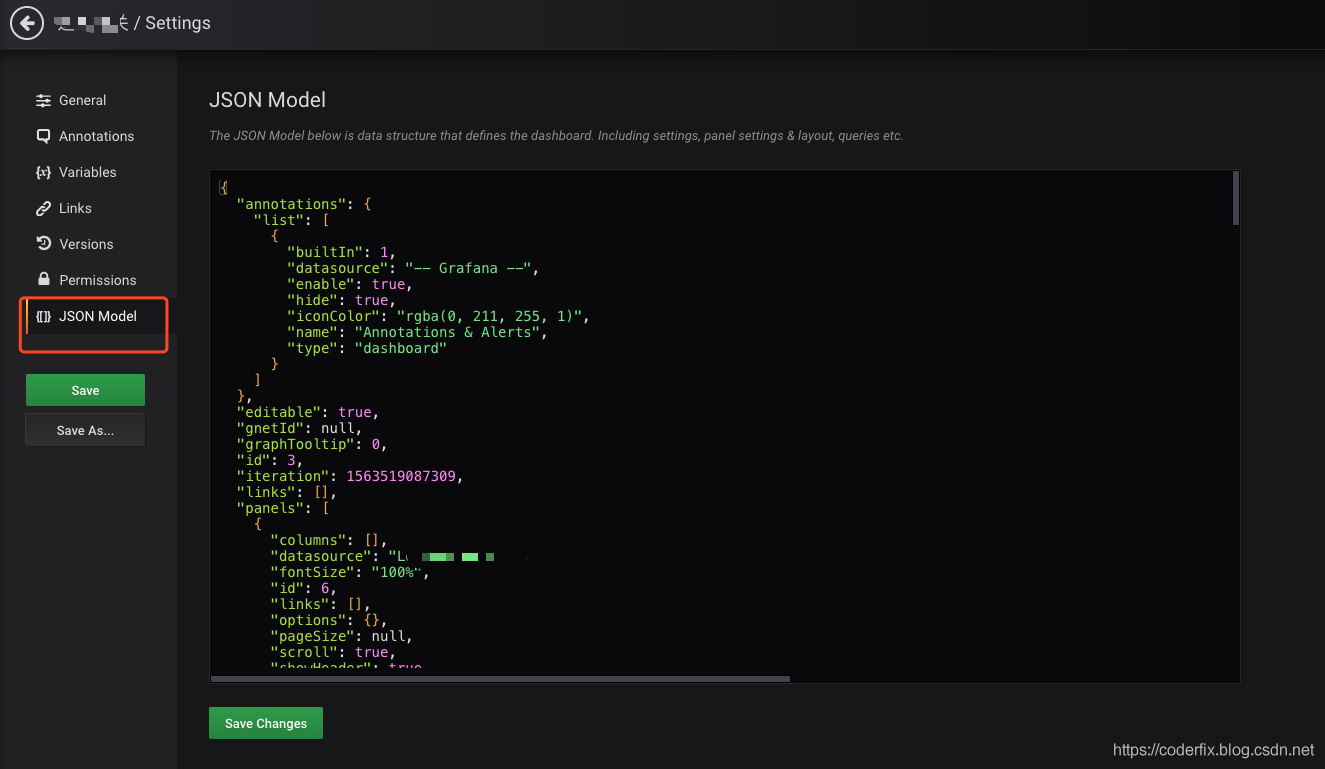
经过修改json并保存之后,我们就得到了nginx访问日志的监控数据
我认为理解Grafana的点在于他是一个时序概念的数据可视化工具。
以后我会分享如何用它做业务相关的数据展示。


 京公网安备 11010802041100号 | 京ICP备19059560号-4 | PHP1.CN 第一PHP社区 版权所有