在Zend Studio中结合Zend Debugger调试
注:Apache/php的配置参见“PHP实战记录系列之一”
注2:Dbg调试和Zend Debugger调试不能同时执行,即php.ini中不能同时启用,切换Zend Studio和PhpED开发工具是,必须切换相应的debugger配置。
如果你使用PhpED开发,需要结合dbg调试,详见在PhpED中结合Dbg调试 。
PHP环境的搭建,详见PHP5.2.9+Apache 2.2.8+mysql整合
安装
下载ZendDebugger-5.2.14-cygwin_nt-i386.zip,解压压缩目录中的
ZendDebugger-5.2.14RC9-cygwin_nt-i386\5_2_x_comp\ZendDebugger.dll到d:/myamp/PHP5.2.9/ext/ZendDebugger.dll
配置php.ini
在末尾增加如下配置
;;配置Zend debugger for Zend Studio
zend_extension_ts=d:/myamp/PHP5.2.9/ext/ZendDebugger.dll
zend_debugger.allow_hosts=127.0.0.1/32,192.168.1.88/24
zend_debugger.expose_remotely=always
测试安装
在浏览器中输入[url]http://localhost/phpinfo.php[/url],找到下图内容即表明安装成功。
即
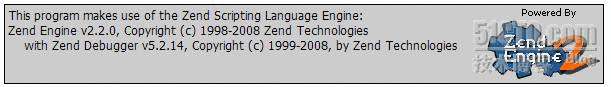
和

如何调试
启动zend studio后,在调试的位置添加断点,在ie中按下“Zend Studio”调试工具按钮“Debug”,即可以进行调试。

扩展2:支持Zend Framework
1、在D:\myamp\Apache2.2\httpd.conf配置文件中开启rewrite
#LoadModule proxy_http_module modules/mod_proxy_http.so


 京公网安备 11010802041100号