2019独角兽企业重金招聘Python工程师标准>>> 
用Prometheus配合Grafana实现多用途的服务监控系统。
一. Prometheus简介
Prometheus是一个开源监控系统,它前身是SoundCloud的警告工具包。从2012年开始,许多公司和组织开始使用Prometheus。该项目的开发人员和用户社区非常活跃,越来越多的开发人员和用户参与到该项目中。
具体介绍及架构信息参考Prometheus官网:https://prometheus.io
二. Grafana介绍
grafana是用于可视化大型测量数据的开源程序,他提供了强大和优雅的方式去创建、共享、浏览数据。dashboard中显示了你不同metric数据源中的数据。
具体参考Grafana官网:https://grafana.com
三.实现实例
1.监控Openresty(Nginx)
1.1下载安装Openresty及nginx-module-vts监控模块
#安装编译环境
yum -y install gcc-c++ pcre pcre-devel zlib zlib-devel openssl openssl-devel#下载openresty和nginx-module-vts监控模块
cd /data/server
wget https://openresty.org/download/openresty-1.13.6.2.tar.gz
git clone https://github.com/vozlt/nginx-module-vts.git#解压openresty
tar -zxf openresty-1.13.6.2.tar.gz#添加模块编译
./configure --add-module=/data/server/nginx-module-vts
make && make install
1.2 修改Openresty配置
不指定安装路径的话Openresty默认安装在/usr/local/openresty
进入目录/usr/local/openresty/nginx/conf 修改配置文件
cd /usr/local/openresty/nginx/conf
#先备份
cp nginx.conf nginx.conf.bak
vim nginx.conf
变更配置如下:
主要两个配置,1.指定时间同步,输出日志格式。2.添加http访问路由
user  nobody;
worker_processes  1;events {worker_connections  1024;
}http {include       mime.types;default_type  application/octet-stream;vhost_traffic_status_zone;log_format main '{ "@timestamp": "$time_local", ''"@fields": { ''"uri":"$request_uri",''"url":"$uri",''"upstream_addr":"$upstream_addr",''"remote_addr": "$remote_addr", ''"remote_user": "$remote_user", ''"body_bytes_sent": "$body_bytes_sent", ''"host":"$host",''"server_addr":"$server_addr",''"request_time": "$request_time", ''"request_time":"$request_time",''"status":"$status",''"request": "$request", ''"request_method": "$request_method", ''"size":$body_bytes_sent,''"upstream_time":"$upstream_response_time"''"http_referrer": "$http_referer", ''"body_bytes_sent":"$body_bytes_sent", ''"http_x_forwarded_for": "$http_x_forwarded_for", ''"http_user_agent": "$http_user_agent" } }';sendfile        on;keepalive_timeout  65;gzip  on;gzip_min_length   1k;gzip_buffers      4 16k;gzip_http_version 1.0;gzip_comp_level   3;gzip_types        text/plain text/css application/x-Javascript text/xml application/xml application/xml+rss text/Javascript application/json application/Javascript;gzip_vary         on;proxy_http_version 1.1;proxy_set_header Connection "";server {listen       80;server_name  localhost;location / {root   html;index  index.html index.htm;}location /status {vhost_traffic_status_display;vhost_traffic_status_display_format html;}}
}
测试配置文件是否有误
./sbin/nginx -t
通过测试后启动Openresty
./sbin/nginx
访问地址http://[ip:port]/status
可以看到如下信息:

1.3配置监控转发模块
这里先使用一个Github上已经开发好的第三方监控模块nginx-vts-exporter
下载地址:https://github.com/hnlq715/nginx-vts-exporter/releases
cd /data/server
wget https://github.com/hnlq715/nginx-vts-exporter/releases/download/v0.10.3/nginx-vts-exporter-0.10.3.linux-amd64.tar.gz
tar -zxf nginx-vts-exporter-0.10.3.linux-amd64.tar.gz
mv nginx-vts-exporter-0.10.3.linux-amd64 nginx-vts-exporter
把nginx-vts-exporter 写成服务(以Centos7.X为例):
在/usr/lib/systemd/system/下创建启动文件
vim /usr/lib/systemd/system/nginx-vts-exporter.service
配置启动可执行文件和参数
[Unit]
Description=nginx-vts-exporter
After=network.target[Service]
Type=simple
ExecStart=/data/server/nginx-vts-exporter/nginx-vts-exporter -nginx.scrape_uri=http://127.0.0.1/status/format/json
Restart=on-failure[Install]
WantedBy=multi-user.target
生效配置文件并启动nginx-vts-exporter
#启动服务,nginx-vts-exporter 默认监听端口为 9913
systemctl enable nginx-vts-exporter
systemctl start nginx-vts-exporter
systemctl status nginx-vts-exporter
1.4 配置Prometheus
配置文件路径:/data/server/prometheus/prometheus.yml,编辑配置文件添加如下内容:
# my global config
global:scrape_interval: 15s # Set the scrape interval to every 15 seconds. Default is every 1 minute.evaluation_interval: 15s # Evaluate rules every 15 seconds. The default is every 1 minute.# scrape_timeout is set to the global default (10s).# Alertmanager configuration
alerting:alertmanagers:- static_configs:- targets:# - alertmanager:9093# Load rules once and periodically evaluate them according to the global 'evaluation_interval'.
rule_files:# - "first_rules.yml"# - "second_rules.yml"# A scrape configuration containing exactly one endpoint to scrape:
# Here it's Prometheus itself.
scrape_configs:# The job name is added as a label `job=
配置服务来启动
vim /usr/lib/systemd/system/prometheus.service
写入如下内容:
[Unit]
Description=prometheus
After=network.target[Service]
Type=simple
ExecStart=/data/server/prometheus/prometheus --config.file=/data/server/prometheus/prometheus.yml
Restart=on-failure[Install]
WantedBy=multi-user.target
启动prometheus服务
#启动prometheus服务
systemctl enable prometheus
systemctl start prometheus
systemctl status prometheus
1.5 安装配置Grafana
下载地址:https://grafana.com/grafana/download?platform=linux
按上述页面说明安装
wget https://dl.grafana.com/oss/release/grafana-6.1.3-1.x86_64.rpm
yum localinstall grafana-6.1.3-1.x86_64.rpm
我比较习惯先修改一下登录密码(默认账号密码 admin admin)
先看一下安装位置
whereis grafana
发现安装在/etc/grafana 去/etc/grafana下编辑grafana.ini文件
修改[security]节点下的password为你期望的值
新版本 安装后输入admin默认密码第一次进入会提示修改密码
启动Grafana服务并查看状态
systemctl start grafana-server
systemctl status grafana-server
访问页面http://[ip]:3000

进入后点击设置data sources add data sources

选择Prometheus填写如下信息

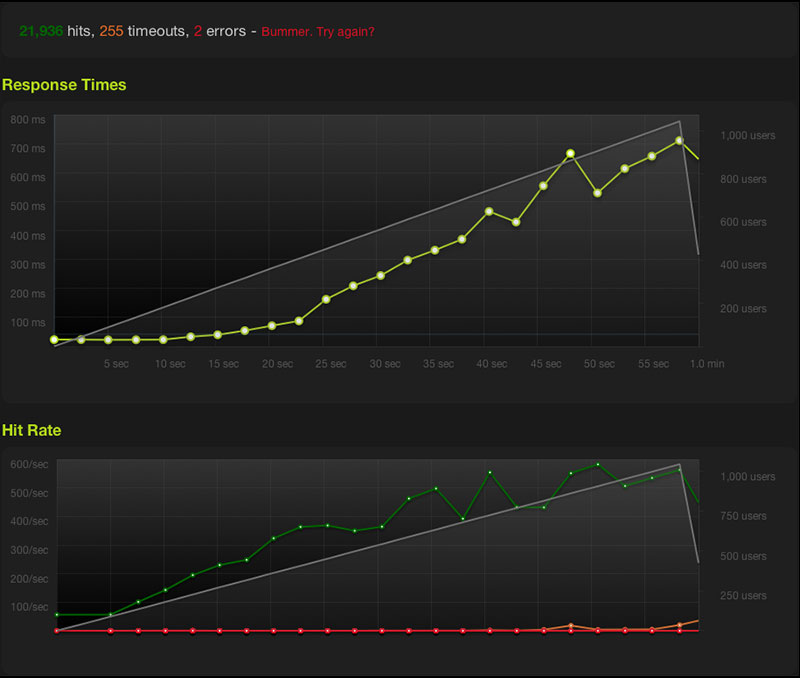
使用Prometheus 2.0 Stats作为Dashboard效果如下:

2.监控Linux主机
2.1监控代理Node exporter 安装
首先在prometheus官网下载 node_exporter。官网地址为: https://prometheus.io/docs/introduction/overview/
#下载 解压
wget https://github.com/prometheus/node_exporter/releases/download/v0.17.0/node_exporter-0.17.0.linux-amd64.tar.gz
tar -zxf node_exporter-0.17.0.linux-amd64.tar.gz
mv node_exporter-0.17.0.linux-amd64.tar.gz node_exporter
cd node_exporter
#后台启动
nohup ./node_exporter &
服务模式启动:
[Unit]
Description=node-exporter
After=network.target[Service]
Type=simple
ExecStart=/data/monitor/node_exporter/node_exporter
Restart=on-failure[Install]
WantedBy=multi-user.target
*查询 node_exporter进程
#默认监听9100
netstat -ntlp|grep 9100
netstat -anp | grep 9100
2.2 prometheus添加代理配置
vim prometheus.yml
添加如下配置:
- job_name: 'tx-server'static_configs:- targets: ['94.191.16.32:9100']
重启prometheus
systemctl restart prometheus
3.监控Kubernetes(k8s)
待补充...
附录:
1.Grafana安装插件
grafana-cli plugins install [michaeldmoore-annunciator-panel]
service grafana-server restart
2.command
#启动nginx服务
systemctl start nginx.service
#设置开机自启动
systemctl enable nginx.service
#停止开机自启动
systemctl disable nginx.service
#查看服务当前状态
systemctl status nginx.service
#重新启动服务
systemctl restart nginx.service
#查看所有已启动的服务
systemctl list-units --type=service


 京公网安备 11010802041100号