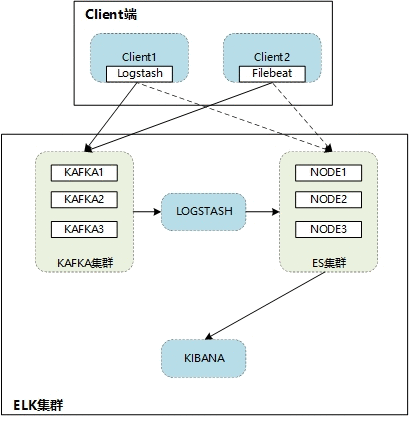
如上图所示:Kafka为3节点集群负责提供消息队列,ES为3节点集群。日志通过logstash或者filebeat传送至Kafka集群,再通过logstash发送至ES集群,最终通过kibana展示出来。(当然client也可以直接将日志发送至ES)
操作系统:CentOS Linux release 7.5.1804 (Core)
系统安装:Minimal Install (Development Tools)
Firewalld:stop
Selinux:disabled
软件包位置:/root
软件安装路径为:/opt
数据目录为:/data
jdk-8u131-linux-x64.tar.gz
zookeeper-3.4.14.tar.gz
kafka_2.12-2.3.0.tgz
elasticsearch-6.3.2.tar.gz
logstash-6.3.2.tar.gz
filebeat-6.3.2-linux-x86_64.tar.gz
kibana-6.3.2-linux-x86_64.tar.gz
ES采用的是三节点部署;
Kafka采用的是三节点部署;
Logstash和kibana为单独部署;
角色 | IP | Hostname |
kafka/zookeeper | 192.168.222.211 | kafka1 |
kafka/zookeeper | 192.168.222.212 | kafka2 |
kafka/zookeeper | 192.168.222.213 | kafka3 |
elasticsearch | 192.168.222.214 | esnode1 |
elasticsearch | 192.168.222.215 | esnode2 |
elasticsearch | 192.168.222.216 | esnode3 |
logstash/filebeat | 192.168.222.217 | logstash1 |
kibana | 192.168.222.218 | kibana1 |
根据环境描述修改配置主机ip
修改hostname
hostnamectl set-hostname esnodeX
修改hosts配置
vi /etc/hosts
192.168.222.211 kafka1
192.168.222.212 kafka2
192.168.222.213 kafka3
192.168.222.214 esnode1
192.168.222.215 esnode2
192.168.222.216 esnode3
192.168.222.217 logstash1
192.168.222.218 kibana1
需要在ES节点上配置即可
vi /etc/security/limits.conf
在末尾加入
* soft core 102400
* hard core 102400
* hard nofile 655360
* soft nofile 655360
* hard nproc 32768
* soft nproc 32768
* soft memlock unlimited
* hard memlock unlimited
vi /etc/security/limits.d/90-nproc.conf(Linux7为20-nproc.conf)
在末尾加入
* soft nproc 4096
root soft nproc unlimited
调整虚拟内存&最大并发连接
vi /etc/sysctl.conf
在末尾加入
vm.max_map_count = 655360
vm.swappiness = 0
修改完成后sysctl -p使配置生效
在所有节点安装jdk
mkdir /usr/local/java
cd /root/
tar zxf jdk-8u131-linux-x64.tar.gz -C /usr/local/java/
确认java版本
ls /usr/local/java/
jdk1.8.0_131
vi /etc/profile
...
export JAVA_HOME=/usr/local/java/jdk1.8.0_131/
export PATH=$PATH:$JAVA_HOME/bin
source /etc/profile
java -version
java version "1.8.0_131"
Java(TM) SE Runtime Environment (build 1.8.0_131-b11)
Java HotSpot(TM) 64-Bit Server VM (build 25.131-b11, mixed mode)
由于zookeeper集群要求节点数>=3,所以安装kafka必须要3台以上。
在kafka1、kafka2、kafka3节点上操作。
mkdir -p /data/zookeeper
cd /root/
tar zxf zookeeper-3.4.14.tar.gz -C /opt/
cd /opt/zookeeper-3.4.14/conf/
cp zoo_sample.cfg zoo.cfg
vi zoo.cfg
# 修改dataDir配置、添加server信息
dataDir=/data/zookeeper
server.1=kafka1:2888:3888
server.2=kafka2:2888:3888
server.3=kafka3:2888:3888
tickTime : 这个时间是作为 Zookeeper 服务器之间或客户端与服务器之间维持心跳的时间间隔,也就是每个 tickTime 时间就会发送一个心跳。
2888 端口:表示的是这个服务器与集群中的 Leader 服务器交换信息的端口;
3888 端口:表示的是万一集群中的 Leader 服务器挂了,需要一个端口来重新进行选举,选出一个新的 Leader ,而这个端口就是用来执行选举时服务器相互通信的端口。
# 指定zookeeper ID(不能与其他节点相同,kafka1:1、kafka 2:2、kafka 3:3)
[root@kafka1 conf]# vi /data/zookeeper/myid
1
[root@kafka2 conf]# vi /data/zookeeper/myid
2
[root@kafka3 conf]# vi /data/zookeeper/myid
3
# 启动zookeeper
配置完成后,在三个节点start zookeeper
/opt/zookeeper-3.4.14/bin/zkServer.sh start
# 停止zookeeper
/opt/zookeeper-3.4.14/bin/zkServer.sh stop
# 需要在kafka启动后查询
[root@kafka1 ~]# /opt/zookeeper-3.4.14/bin/zkServer.sh status
ZooKeeper JMX enabled by default
Using config: /opt/zookeeper-3.4.14/bin/../conf/zoo.cfg
Mode: follower
[root@kafka2 ~]# /opt/zookeeper-3.4.14/bin/zkServer.sh status
ZooKeeper JMX enabled by default
Using config: /opt/zookeeper-3.4.14/bin/../conf/zoo.cfg
Mode: follower
[root@kafka3 ~]# /opt/zookeeper-3.4.14/bin/zkServer.sh status
ZooKeeper JMX enabled by default
Using config: /opt/zookeeper-3.4.14/bin/../conf/zoo.cfg
Mode: leader
# 日志和pid位于dataDir目录下
[root@kafka1 zookeeper]# ls /data/zookeeper/
myid version-2 zookeeper.out zookeeper_server.pid
在kafka1、kafka2、kafka3节点上操作。
mkdir -p /data/kafka
cd /root/
tar zxf kafka_2.12-2.3.0.tgz -C /opt/
cd /opt/kafka_2.12-2.3.0/config
# 修改以下三项
# kafka1
vi server.properties
broker.id=0
listeners=PLAINTEXT://192.168.222.211:9092
zookeeper.cOnnect=kafka1:2181,kafka2:2181,kafka3:2181
# kafka2
vi server.properties
broker.id=1
listeners=PLAINTEXT://192.168.222.212:9092
zookeeper.cOnnect=kafka1:2181,kafka2:2181,kafka3:2181
# kafka3
vi server.properties
broker.id=2
listeners=PLAINTEXT://192.168.222.213:9092
zookeeper.cOnnect=kafka1:2181,kafka2:2181,kafka3:2181
# 启动kafka
# kafka1 / kafka2 / kafka3
cd /opt/kafka_2.12-2.3.0/
nohup bin/kafka-server-start.sh config/server.properties &
# 如果使用kafka-manager监控,需要开启JMX,否则会有以下报错:
java.lang.IllegalArgumentException: requirement failed: No jmx port but jmx polling enabled!
# 启动kafka服务时指定JMX_PORT值:
JMX_PORT=9999 nohup bin/kafka-server-start.sh config/server.properties &
# 停止kafka
ps -elf|grep kafka
kill -9 pid
cd /opt/kafka_2.12-2.3.0/logs/
tailf server.log
[2019-09-05 09:17:14,646] INFO [ProducerId Manager 0]: Acquired new producerId block (brokerId:0,blockStartProducerId:0,blockEndProducerId:999) by writing to Zk with path version 1 (kafka.coordinator.transaction.ProducerIdManager)
[2019-09-05 09:17:14,691] INFO [TransactionCoordinator id=0] Starting up. (kafka.coordinator.transaction.TransactionCoordinator)
[2019-09-05 09:17:14,693] INFO [TransactionCoordinator id=0] Startup complete. (kafka.coordinator.transaction.TransactionCoordinator)
[2019-09-05 09:17:14,699] INFO [Transaction Marker Channel Manager 0]: Starting (kafka.coordinator.transaction.TransactionMarkerChannelManager)
[2019-09-05 09:17:14,791] INFO [/config/changes-event-process-thread]: Starting (kafka.common.ZkNodeChangeNotificationListener$ChangeEventProcessThread)
[2019-09-05 09:17:14,831] INFO [SocketServer brokerId=0] Started data-plane processors for 1 acceptors (kafka.network.SocketServer)
[2019-09-05 09:17:14,845] INFO Kafka version: 2.3.0 (org.apache.kafka.common.utils.AppInfoParser)
[2019-09-05 09:17:14,845] INFO Kafka commitId: fc1aaa116b661c8a (org.apache.kafka.common.utils.AppInfoParser)
[2019-09-05 09:17:14,845] INFO Kafka startTimeMs: 1567646234832 (org.apache.kafka.common.utils.AppInfoParser)
[2019-09-05 09:17:14,851] INFO [KafkaServer id=0] started (kafka.server.KafkaServer)
# 创建topic(kafka3:2181)
/opt/kafka_2.12-2.3.0/bin/kafka-topics.sh --create --zookeeper kafka3:2181 --replication-factor 3 --partitions 1 --topic test-topic
Created topic test-topic.
# 查看topic
/opt/kafka_2.12-2.3.0/bin/kafka-topics.sh --describe --zookeeper kafka3:2181 --topic test-topic
Topic:test-topic PartitionCount:1 ReplicationFactor:3 Configs:
Topic: test-topic Partition: 0 Leader: 2 Replicas: 2,1,0 Isr: 2,1,0
/opt/kafka_2.12-2.3.0/bin/kafka-topics.sh --describe --zookeeper kafka1:2181 --topic test-topic
Topic:test-topic PartitionCount:1 ReplicationFactor:3 Configs:
Topic: test-topic Partition: 0 Leader: 2 Replicas: 2,1,0 Isr: 2,1,0
kafka_2.12-2.3.0]# /opt/kafka_2.12-2.3.0/bin/kafka-topics.sh --describe --zookeeper kafka2:2181 --topic test-topic
Topic:test-topic PartitionCount:1 ReplicationFactor:3 Configs:
Topic: test-topic Partition: 0 Leader: 2 Replicas: 2,1,0 Isr: 2,1,0
# 发送消息
运行producer并在控制台中输一些消息,这些消息将被发送到服务端:
/opt/kafka_2.12-2.3.0/bin/kafka-console-producer.sh --broker-list kafka3:9092 --topic test-topic
>this is test!
# 启动consumer
Kafka也有一个命令行consumer可以读取消息并输出到标准输出:
/opt/kafka_2.12-2.3.0/bin/kafka-console-consumer.sh --bootstrap-server kafka2:9092 --topic test-topic --from-beginning
this is test!
# 遇到过以下错误,因为配置文件里指定的是主机名esnode3,所以这里需要使用主机名或者IP地址。
[root@kafka3 kafka_2.12-2.3.0]# bin/kafka-console-producer.sh --broker-list localhost:9092 --topic test-topic
[2019-09-04 14:32:57,034] WARN [Producer clientId=console-producer] Connection to node -1 (localhost/127.0.0.1:9092) could not be established. Broker may not be available. (org.apache.kafka.clients.NetworkClient)
# 列出所有topic
/opt/kafka_2.12-2.3.0/bin/kafka-topics.sh --list --zookeeper kafka3:2181
# 查看topic信息
/opt/kafka_2.12-2.3.0/bin/kafka-topics.sh --describe --zookeeper kafka3:2181 --topic system-secure
# 查看topic(system-secure)里的内容。--from-beginning是从最开始到结尾
/opt/kafka_2.12-2.3.0/bin/kafka-console-consumer.sh --bootstrap-server kafka2:9092 --topic system-secure --from-beginning
在RHEL7以前的版本可将脚本加入rc.local开机自启动,但是RHEL7以后的版本默认不启用rc.local,推荐使用systemd配置。
# THIS FILE IS ADDED FOR COMPATIBILITY PURPOSES
#
# It is highly advisable to create own systemd services or udev rules
# to run scripts during boot instead of using this file.
#
# In contrast to previous versions due to parallel execution during boot
# this script will NOT be run after all other services.
#
# Please note that you must run 'chmod +x /etc/rc.d/rc.local' to ensure
# that this script will be executed during boot.
vi /etc/rc.local
# 在末尾加入以下信息
# zookeeper
cd /opt/zookeeper-3.4.14/bin/
./zkServer.sh start
# kafka
cd /opt/kafka_2.12-2.3.0/
JMX_PORT=9999 nohup bin/kafka-server-start.sh config/server.properties &
# kafka-manager
cd /kafka-manager-2.0.0.2/
nohup bin/kafka-manager -Dconfig.file=conf/application.conf -Dhttp.port=8088 >> kafka-manager.log 2>&1 &
# kafka-offset-console
cd /opt/kafka-offset-console/
nohup java -cp KafkaOffsetMonitor-assembly-0.4.6-SNAPSHOT.jar
com.quantifind.kafka.offsetapp.OffsetGetterWeb
--offsetStorage kafka
--kafkaBrokers kafka1:9092,kafka2:9092,kafka3:9092
--kafkaSecurityProtocol PLAINTEXT
--zk kafka1:2181,kafka2:2181,kafka3:2181
--port 8787
--refresh 10.seconds
--retain 2.days
--dbName offsetapp_kafka >> KafkaOffsetMonitor.log 2>&1 &
# end
# 配置zookeeper的systemd脚本
vi /usr/lib/systemd/system/zookeeperd.service
[Unit]
Description=The Zookeeper Server
[Service]
Type=forking
EnvirOnment="JAVA_HOME=/usr/local/java/jdk1.8.0_131/"
PIDFile=/data/zookeeper/zookeeper_server.pid
ExecStart=/opt/zookeeper-3.4.14/bin/zkServer.sh start
ExecStop=/opt/zookeeper-3.4.14/bin/zkServer.sh stop
Restart=on-failure
[Install]
WantedBy=multi-user.target
# 手动停止zookeeper,然后使用systemd启动
/opt/zookeeper-3.4.14/bin/zkServer.sh stop
systemctl start zookeeperd
systemctl enable zookeeperd
# 配置kafka的systemd脚本
vi /usr/lib/systemd/system/kafkad.service
[Unit]
Description=The Kafka Server
After=network.target
[Service]
Type=simple
EnvirOnment="JAVA_HOME=/usr/local/java/jdk1.8.0_131/"
EnvirOnment="JMX_PORT=9999"
ExecStart=/opt/kafka_2.12-2.3.0/bin/kafka-server-start.sh /opt/kafka_2.12-2.3.0/config/server.properties
ExecStop=/bin/kill -9 ${MAINPID}
Restart=on-failure
[Install]
WantedBy=multi-user.target
# 手动停止kafka,然后使用systemd启动
systemctl start kakfad
# 测试过程中遇到个错误,当service name是kafka的时候会提示
# Failed to start kakfa.service: Unit not found.
# 后来把service name改成kafkad.service就可以正常运行了。
systemctl enable kakfad
# 配置kafka的systemd脚本
vi /usr/lib/systemd/system/kafka-monitord.service
[Unit]
Description=The Kafka-monitor Server
After=network.target
[Service]
Type=simple
PIDFile=/opt/kafka-manager-2.0.0.2/RUNNING_PID
EnvirOnment="JAVA_HOME=/usr/local/java/jdk1.8.0_131/"
ExecStart=/opt/kafka-manager-2.0.0.2/bin/kafka-manager -Dconfig.file=/opt/kafka-manager-2.0.0.2/conf/application.conf -Dhttp.port=8088
ExecStopPost=/usr/bin/rm -f /opt/kafka-manager-2.0.0.2/RUNNING_PID
Restart=on-failure
[Install]
WantedBy=multi-user.target
# 手动停止kafka,然后使用systemd启动
systemctl start kafka-monitord.service
systemctl enable kafka-monitord.service
在esnode1、esnode2、esnode3节点上操作。
mkdir -p /data/es /data/eslog
创建用户,es必须以非root用户启动
useradd elk
cd /root/
tar zxf elasticsearch-6.3.2.tar.gz -C /opt/
cd /opt/elasticsearch-6.3.2/config/
[root@esnode1 config]# ls
elasticsearch.yml jvm.options log4j2.properties role_mapping.yml roles.yml users users_roles
请参考三节点配置
# 根据资源情况分配内存
vi /opt/elasticsearch-6.3.2/config/jvm.options
-Xms4g
-Xmx4g
# elasticsearch.yml其他配置
# 分片(shard)与副本(replica)的数量,如果不指定默认配置参数shards=5,replicas=1。
# 一般以(节点数*1.5或3倍)来计算,比如有4个节点,分片数量一般是6个到12个,每个分片一般分配一个副本
index.number_of_shards: 5
index.number_of_replicas: 1
# 可以在创建index时指定
curl -XPUT http://demo1:9200/newindex -d '{
> settings: {
> number_of_replicas: 1,
> number_of_shards: 3
> }
> }'
{"acknowledged":true}
cluster.name: es-demo
# esalone
vi /opt/elasticsearch-6.3.2/config/elasticsearch.yml
cluster.name: elk-alone
node.name: esalone
path.data: /data/es
path.logs: /data/eslog
network.host: 192.168.222.211
discovery.zen.ping.unicast.hosts: ["esalone",]
# esnode1
vi /opt/elasticsearch-6.3.2/config/elasticsearch.yml
cluster.name: es-demo
node.name: esnode1
path.data: /data/es
path.logs: /data/eslog
network.host: 192.168.222.211
discovery.zen.ping.unicast.hosts: ["esnode1", "esnode2"]
discovery.zen.minimum_master_nodes: 1
# discovery.zen.minimum_master_nodes: 1由于只部署两个节点,因此设置为1,否则当master宕机,将无法重新选取master
# esnode2
vi /opt/elasticsearch-6.3.2/config/elasticsearch.yml
cluster.name: es-demo
node.name: esnode2
path.data: /data/es
path.logs: /data/eslog
network.host: 192.168.222.212
discovery.zen.ping.unicast.hosts: ["esnode1", "esnode2"]
discovery.zen.minimum_master_nodes: 1
# esnode1 master
vi /opt/elasticsearch-6.3.2/config/elasticsearch.yml
node.master: true
node.data: false
cluster.name: es-demo
node.name: esnode1
path.data: /data/es
path.logs: /data/eslog
http.port: 9200
transport.tcp.port: 9300
discovery.zen.ping_timeout: 100s
network.host: 192.168.222.214
discovery.zen.ping.unicast.hosts: ["esnode1", "esnode2", "esnode3"]
# esnode2 data.node
node.master: false
node.data: true
cluster.name: es-demo
node.name: esnode2
path.data: /data/es
path.logs: /data/eslog
http.port: 9200
transport.tcp.port: 9300
discovery.zen.ping_timeout: 100s
network.host: 192.168.222.215
discovery.zen.ping.unicast.hosts: ["esnode1", "esnode2", "esnode3"]
# esnode3 data.node
node.master: false
node.data: true
cluster.name: es-demo
node.name: esnode3
path.data: /data/es
path.logs: /data/eslog
http.port: 9200
transport.tcp.port: 9300
discovery.zen.ping_timeout: 100s
network.host: 192.168.222.216
discovery.zen.ping.unicast.hosts: ["esnode1", "esnode2", "esnode3"]
修改ES目录权限
chown -R elk. /opt/elasticsearch-6.3.2/ /data/es /data/eslog
# 启动ES
su - elk
cd /opt/elasticsearch-6.3.2
bin/elasticsearch -d
# 停止ES
su - elk
ps -elf|grep elasticsearch
kill -9 pid
tailf /data/eslog/es-demo.log
[2019-09-05T09:41:16,610][INFO ][o.e.p.PluginsService ] [esnode3] loaded module [x-pack-watcher]
[2019-09-05T09:41:16,610][INFO ][o.e.p.PluginsService ] [esnode3] no plugins loaded
[2019-09-05T09:41:21,277][INFO ][o.e.x.s.a.s.FileRolesStore] [esnode3] parsed [0] roles from file [/opt/elasticsearch-6.3.2/config/roles.yml]
[2019-09-05T09:41:22,255][INFO ][o.e.x.m.j.p.l.CppLogMessageHandler] [controller/15516] [Main.cc@109] controller (64 bit): Version 6.3.2 (Build 903094f295d249) Copyright (c) 2018 Elasticsearch BV
[2019-09-05T09:41:22,765][DEBUG][o.e.a.ActionModule ] Using REST wrapper from plugin org.elasticsearch.xpack.security.Security
[2019-09-05T09:41:23,044][INFO ][o.e.d.DiscoveryModule ] [esnode3] using discovery type [zen]
[2019-09-05T09:41:24,105][INFO ][o.e.n.Node ] [esnode3] initialized
[2019-09-05T09:41:24,105][INFO ][o.e.n.Node ] [esnode3] starting ...
[2019-09-05T09:41:24,284][INFO ][o.e.t.TransportService ] [esnode3] publish_address {192.168.222.216:9300}, bound_addresses {192.168.222.216:9300}
[2019-09-05T09:41:24,303][INFO ][o.e.b.BootstrapChecks ] [esnode3] bound or publishing to a non-loopback address, enforcing bootstrap checks
[2019-09-05T09:41:54,335][WARN ][o.e.n.Node ] [esnode3] timed out while waiting for initial discovery state - timeout: 30s
[2019-09-05T09:41:54,347][INFO ][o.e.x.s.t.n.SecurityNetty4HttpServerTransport] [esnode3] publish_address {192.168.222.216:9200}, bound_addresses {192.168.222.216:9200}
[2019-09-05T09:41:54,347][INFO ][o.e.n.Node ] [esnode3] started
# 浏览器访问任意节点
http://esnode1:9200/_cluster/health?pretty
# status为green表示正常,yellow为警告,red为故障
# number_of_nodes节点数为3,number_of_data_nodes数据节点数为2。符合预期。
{
"cluster_name" : "es-demo",
"status" : "green",
"timed_out" : false,
"number_of_nodes" : 3,
"number_of_data_nodes" : 2,
"active_primary_shards" : 0,
"active_shards" : 0,
"relocating_shards" : 0,
"initializing_shards" : 0,
"unassigned_shards" : 0,
"delayed_unassigned_shards" : 0,
"number_of_pending_tasks" : 0,
"number_of_in_flight_fetch" : 0,
"task_max_waiting_in_queue_millis" : 0,
"active_shards_percent_as_number" : 100.0
}
在logstash1节点上操作。
cd /root/
tar zxf logstash-6.3.2.tar.gz -C /opt/
cd /opt/logstash-6.3.2
[root@logstash1 logstash-6.3.2]# ls
bin conf config CONTRIBUTORS data Gemfile Gemfile.lock lib LICENSE.txt logs logstash-core logstash-core-plugin-api modules NOTICE.TXT tools vendor x-pack
/opt/logstash-6.3.2/bin/logstash -e 'input { stdin { type => test } } output { stdout { } }'
Sending Logstash's logs to /opt/logstash-6.3.2/logs which is now configured via log4j2.properties
[2019-09-05T09:48:44,776][INFO ][logstash.setting.writabledirectory] Creating directory {:setting=>"path.queue", :path=>"/opt/logstash-6.3.2/data/queue"}
[2019-09-05T09:48:44,788][INFO ][logstash.setting.writabledirectory] Creating directory {:setting=>"path.dead_letter_queue", :path=>"/opt/logstash-6.3.2/data/dead_letter_queue"}
[2019-09-05T09:48:45,412][WARN ][logstash.config.source.multilocal] Ignoring the 'pipelines.yml' file because modules or command line options are specified
[2019-09-05T09:48:45,466][INFO ][logstash.agent ] No persistent UUID file found. Generating new UUID {:uuid=>"2bc34073-1e96-483a-9814-c9d1c5405b93", :path=>"/opt/logstash-6.3.2/data/uuid"}
[2019-09-05T09:48:46,259][INFO ][logstash.runner ] Starting Logstash {"logstash.version"=>"6.3.2"}
[2019-09-05T09:48:49,680][INFO ][logstash.pipeline ] Starting pipeline {:pipeline_id=>"main", "pipeline.workers"=>2, "pipeline.batch.size"=>125, "pipeline.batch.delay"=>50}
[2019-09-05T09:48:49,836][INFO ][logstash.pipeline ] Pipeline started successfully {:pipeline_id=>"main", :thread=>"#
The stdin plugin is now waiting for input:
[2019-09-05T09:48:49,939][INFO ][logstash.agent ] Pipelines running {:count=>1, :running_pipelines=>[:main], :non_running_pipelines=>[]}
[2019-09-05T09:48:50,234][INFO ][logstash.agent ] Successfully started Logstash API endpoint {:port=>9600}
logstash for test
{
"@version" => "1",
"message" => "logstash for test",
"@timestamp" => 2019-09-05T01:49:07.161Z,
"type" => "test",
"host" => "logstash1"
}
input {
file {
type => "rsyslog"
path => "/var/log/messages"
discover_interval => 10 # 监听间隔
start_position => "beginning" #从头开始
}
}
output {
elasticsearch {
hosts => ["192.168.222.214:9200","192.168.222.215:9200","192.168.222.216:9200"]
index => "messages-%{+YYYY.MM.dd}"
}
}
%{+YYYY.MM.dd}
这里日期格式建议统一,以便后期对es的index进行统一管理。
input {
file {
type=>"haproxy-access"
path=>"/var/log/haproxy.log"
discover_interval => 10 # 监听间隔
start_position => "beginning" #从头开始
}
}
output {
kafka {
bootstrap_servers => "192.168.222.211:9092,192.168.222.212:9092,192.168.222.213:9092"
topic_id => "system-secure"
compression_type => "snappy"
}
stdout {
codec => rubydebug
}
}
# 注:
bootstrap_servers => "192.168.222.211:9092,192.168.222.212:9092,192.168.222.213:9092":指定kafka节点
topic_id => "system-secure":在kafka上创建“system-secure”的topic
compression_type => "snappy":指定压缩类型
codec => rubydebug:这是标准输出到终端,可以用于调试看有没有输出,注意输出的方向可以有多个
# 可通过kafka查看是否生成topic
[root@kafka1 ~]# /opt/kafka_2.12-2.3.0/bin/kafka-topics.sh --list --zookeeper kafka3:2181
__consumer_offsets
system-secure
# 查看topic里的内容
[root@kafka1 ~]# /opt/kafka_2.12-2.3.0/bin/kafka-console-consumer.sh --bootstrap-server kafka2:9092 --topic system-secure --from-beginning
……
input{
kafka{
bootstrap_servers => "192.168.222.211:9092,192.168.222.212:9092,192.168.222.213:9092"
topics => ["topic-haproxy","test-topic"]
consumer_threads => 1
decorate_events => true
# codec => "json"
auto_offset_reset => "latest"
}
}
output{
elasticsearch {
hosts=>["192.168.222.214:9200","192.168.222.215:9200","192.168.222.216:9200"]
index => "system-log-%{+YYYY.MM.dd}"
}
stdout{
codec => "rubydebug"
}
}
input
topics => ["topic-haproxy","test-topic"]:可以指定kafka上的多个topic
output
hosts=>["192.168.222.214:9200","192.168.222.215:9200","192.168.222.216:9200"]:指定ES节点
index => "system-log-%{+YYYY.MM.dd}":会在ES创建system-log-日期的index
创建conf文件用于收集日志(可参考上面的配置实例)
vi /opt/logstash-6.3.2/config/syslog-2-es.conf
input {
file {
type=>"syslog"
path=>"/var/log/messages"
discover_interval => 10 # 监听间隔
start_position => "beginning" #从头开始
}
}
output {
elasticsearch {
hosts =>["192.168.222.214:9200","192.168.222.215:9200","192.168.222.216:9200"]
index =>"syslog-%{+YYYY.MM.dd}"
}
}
# 启动logstash
cd /opt/logstash-6.3.2/
nohup bin/logstash -f config/syslog-2-es.conf &
# 启动前可先测试配置文件
# bin/logstash -f config/syslog-2-es.conf -t
# 停止logstash
ps -elf|grep logstash
kill -9 pid
cd /opt/logstash-6.3.2/
tail -f nohup.out
Sending Logstash's logs to /opt/logstash-6.3.2/logs which is now configured via log4j2.properties
[2019-09-05T11:27:48,163][WARN ][logstash.config.source.multilocal] Ignoring the 'pipelines.yml' file because modules or command line options are specified
[2019-09-05T11:27:48,949][INFO ][logstash.runner ] Starting Logstash {"logstash.version"=>"6.3.2"}
[2019-09-05T11:27:51,770][INFO ][logstash.pipeline ] Starting pipeline {:pipeline_id=>"main", "pipeline.workers"=>2, "pipeline.batch.size"=>125, "pipeline.batch.delay"=>50}
[2019-09-05T11:27:52,402][INFO ][logstash.outputs.elasticsearch] Elasticsearch pool URLs updated {:changes=>{:removed=>[], :added=>[http://192.168.222.214:9200/, http://192.168.222.215:9200/, http://192.168.222.216:9200/]}}
[2019-09-05T11:27:52,415][INFO ][logstash.outputs.elasticsearch] Running health check to see if an Elasticsearch connection is working {:healthcheck_url=>http://192.168.222.214:9200/, :path=>"/"}
[2019-09-05T11:27:52,720][WARN ][logstash.outputs.elasticsearch] Restored connection to ES instance {:url=>"http://192.168.222.214:9200/"}
[2019-09-05T11:27:52,792][INFO ][logstash.outputs.elasticsearch] ES Output version determined {:es_version=>6}
[2019-09-05T11:27:52,796][WARN ][logstash.outputs.elasticsearch] Detected a 6.x and above cluster: the `type` event field won't be used to determine the document _type {:es_version=>6}
[2019-09-05T11:27:52,798][INFO ][logstash.outputs.elasticsearch] Running health check to see if an Elasticsearch connection is working {:healthcheck_url=>http://192.168.222.215:9200/, :path=>"/"}
[2019-09-05T11:27:52,808][WARN ][logstash.outputs.elasticsearch] Restored connection to ES instance {:url=>"http://192.168.222.215:9200/"}
[2019-09-05T11:27:52,818][INFO ][logstash.outputs.elasticsearch] Running health check to see if an Elasticsearch connection is working {:healthcheck_url=>http://192.168.222.216:9200/, :path=>"/"}
[2019-09-05T11:27:52,824][WARN ][logstash.outputs.elasticsearch] Restored connection to ES instance {:url=>"http://192.168.222.216:9200/"}
[2019-09-05T11:27:52,867][INFO ][logstash.outputs.elasticsearch] New Elasticsearch output {:class=>"LogStash::Outputs::ElasticSearch", :hosts=>["//192.168.222.214:9200", "//192.168.222.215:9200", "//192.168.222.216:9200"]}
[2019-09-05T11:27:52,895][INFO ][logstash.outputs.elasticsearch] Using mapping template from {:path=>nil}
[2019-09-05T11:27:52,908][INFO ][logstash.outputs.elasticsearch] Attempting to install template {:manage_template=>{"template"=>"logstash-*", "version"=>60001, "settings"=>{"index.refresh_interval"=>"5s"}, "mappings"=>{"_default_"=>{"dynamic_templates"=>[{"message_field"=>{"path_match"=>"message", "match_mapping_type"=>"string", "mapping"=>{"type"=>"text", "norms"=>false}}}, {"string_fields"=>{"match"=>"*", "match_mapping_type"=>"string", "mapping"=>{"type"=>"text", "norms"=>false, "fields"=>{"keyword"=>{"type"=>"keyword", "ignore_above"=>256}}}}}], "properties"=>{"@timestamp"=>{"type"=>"date"}, "@version"=>{"type"=>"keyword"}, "geoip"=>{"dynamic"=>true, "properties"=>{"ip"=>{"type"=>"ip"}, "location"=>{"type"=>"geo_point"}, "latitude"=>{"type"=>"half_float"}, "longitude"=>{"type"=>"half_float"}}}}}}}}
[2019-09-05T11:27:53,443][INFO ][logstash.pipeline ] Pipeline started successfully {:pipeline_id=>"main", :thread=>"#
[2019-09-05T11:27:53,576][INFO ][logstash.agent ] Pipelines running {:count=>1, :running_pipelines=>[:main], :non_running_pipelines=>[]}
[2019-09-05T11:27:54,413][INFO ][logstash.agent ] Successfully started Logstash API endpoint {:port=>9600}
启动完成后访问es,查看是否有索引(正常产生数据)
[root@esnode1 ~]# curl http://esnode1:9200/_cat/indices?v
health status index uuid pri rep docs.count docs.deleted store.size pri.store.size
green open .kibana nM-_L7acQ2S-i5INmT4v2A 1 1 2 0 20.8kb 10.4kb
green open syslog-2019-09-09 sfFCvc5pQgWDXNeTeECiPw 5 1 8199 0 5.1mb 2.5mb
在kibana1节点上操作。
useradd elk
mkdir -p /data/kibana
cd /root/
tar zxf kibana-6.3.2-linux-x86_64.tar.gz -C /opt/
cd /opt/kibana-6.3.2-linux-x86_64/
[root@kibana1 kibana-6.3.2-linux-x86_64]# ls
bin config data LICENSE.txt node node_modules NOTICE.txt optimize package.json plugins README.txt src webpackShims yarn.lock
[root@kibana1 kibana-6.3.2-linux-x86_64]# grep '^[a-Z]' config/kibana.yml
server.host: "192.168.222.218"
server.port: 5601
server.name: "kibana1"
elasticsearch.url: "http://esnode1:9200"
# 指定kibana日志位置,不指定为标准输出
logging.dest: /data/kibana/kibana.log
# 指定kibana pid位置,不指定不会生成pid文件
pid.file: /data/kibana/kibana.pid
# 如果启用了认证则需要相应的输入用户名和密码
# elasticsearch.username: "kibana"
# elasticsearch.password: "password"
前提是elasticSearch已经启动且状态正常
# 修改ES目录权限
chown -R elk. /opt/kibana-6.3.2-linux-x86_64/ /data/kibana
# 启动Kibana
su - elk
cd /opt/kibana-6.3.2-linux-x86_64/bin
./kibana &
# 停止kibana
获取pid(如果指定了pid文件,直接cat /data/kibana/kibana.pid)
ps -elf|grep node
kill -9 15409
查看kibana日志
tailf /data/kibana/kibana.log
{"type":"log","@timestamp":"2019-09-06T22:00:50Z","tags":["status","plugin:watcher@6.3.2","info"],"pid":18599,"state":"green","message":"Status changed from yellow to green - Ready","prevState":"yellow","prevMsg":"Waiting for Elasticsearch"}
{"type":"log","@timestamp":"2019-09-06T22:00:50Z","tags":["status","plugin:index_management@6.3.2","info"],"pid":18599,"state":"green","message":"Status changed from yellow to green - Ready","prevState":"yellow","prevMsg":"Waiting for Elasticsearch"}
{"type":"log","@timestamp":"2019-09-06T22:00:50Z","tags":["status","plugin:graph@6.3.2","info"],"pid":18599,"state":"green","message":"Status changed from yellow to green - Ready","prevState":"yellow","prevMsg":"Waiting for Elasticsearch"}
{"type":"log","@timestamp":"2019-09-06T22:00:50Z","tags":["status","plugin:security@6.3.2","info"],"pid":18599,"state":"green","message":"Status changed from yellow to green - Ready","prevState":"yellow","prevMsg":"Waiting for Elasticsearch"}
{"type":"log","@timestamp":"2019-09-06T22:00:50Z","tags":["status","plugin:grokdebugger@6.3.2","info"],"pid":18599,"state":"green","message":"Status changed from yellow to green - Ready","prevState":"yellow","prevMsg":"Waiting for Elasticsearch"}
{"type":"log","@timestamp":"2019-09-06T22:00:50Z","tags":["status","plugin:logstash@6.3.2","info"],"pid":18599,"state":"green","message":"Status changed from yellow to green - Ready","prevState":"yellow","prevMsg":"Waiting for Elasticsearch"}
{"type":"log","@timestamp":"2019-09-06T22:00:50Z","tags":["status","plugin:reporting@6.3.2","info"],"pid":18599,"state":"green","message":"Status changed from yellow to green - Ready","prevState":"yellow","prevMsg":"Waiting for Elasticsearch"}
{"type":"log","@timestamp":"2019-09-06T22:00:50Z","tags":["info","monitoring-ui","kibana-monitoring"],"pid":18599,"message":"Starting all Kibana monitoring collectors"}
{"type":"log","@timestamp":"2019-09-06T22:00:50Z","tags":["license","info","xpack"],"pid":18599,"message":"Imported license information from Elasticsearch for the [monitoring] cluster: mode: basic | status: active"}
{"type":"log","@timestamp":"2019-09-06T22:00:58Z","tags":["listening","info"],"pid":18599,"message":"Server running at http://192.168.222.218:5601"}
打开浏览器,输入”http://IP:5601”后查看页面
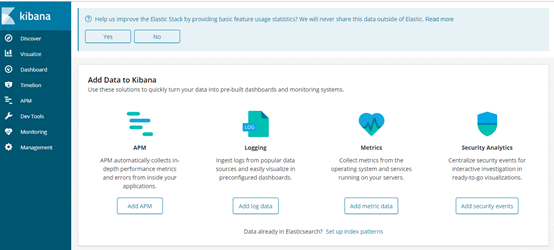
如前面的Logstash、ElasticSearch等正常,且Kafka中有数据传入,则会有建索引界面,建完索引后,点击“Discover”按钮,出现日志查询界面
(由于没有日志过来,这里都是空的)

当有数据生成时,可以看到相应的index
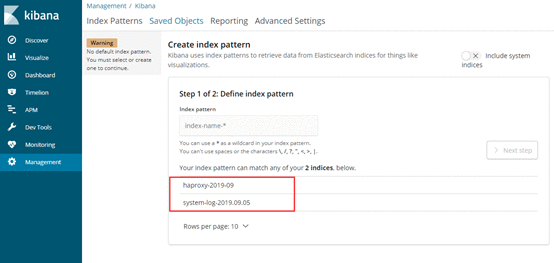
可以根据不同的索引,创建不同的index pattern

同样也可以匹配所有

可以定义filter
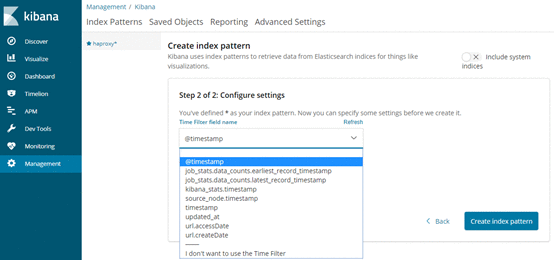
配置完成后,可在discover查看

logstash 和filebeat都具有日志收集功能,filebeat更轻量,占用资源更少,但logstash 具有filter功能,能过滤分析日志。一般结构都是filebeat采集日志,然后发送到消息队列,redis,kafaka。然后logstash去获取,利用filter功能过滤分析,然后存储到elasticsearch中.
cd /root/
tar zxf filebeat-6.3.2-linux-x86_64.tar.gz -C /opt/
cd /opt/filebeat-6.3.2-linux-x86_64/
ls
data fields.yml filebeat filebeat.reference.yml filebeat.yml kibana LICENSE.txt module modules.d NOTICE.txt README.md
filebeat.inputs:
- type: log
# Change to true to enable this input configuration.
enabled: true
paths:
- /var/log/*
- /var/log/httpd/*
output.elasticsearch:
hosts: ["192.168.222.214:9200","192.168.222.215:9200","192.168.222.216:9200"]
index: "filebeat-%{+YYYY.MM.dd}"
setup.template.name: "filebeat"
setup.template.pattern: "filebeat-*"
paths:
- /var/log/* # /var/log/*指定的是/var/log/目录下的所有文件(不包含子目录)。filebeat不会自动递归日志目录下的子目录, 如果需要递归子目录可以使用类似 /var/log/*/*.log
index
# index名称不能是大写,否则无法在ES上创建
索引名字。(PS:意思是要发到哪个索引中去)。默认是"filebeat-%{[beat.version]}-%{+yyyy.MM.dd}"(例如,"filebeat-6.3.2-2017.04.26")。如果你想改变这个设置,你需要配置 setup.template.name 和 setup.template.pattern 选项。如果你用内置的Kibana dashboards,你也需要设置setup.dashboards.index选项。
%{+YYYY.MM.dd}
这里日期格式建议统一,以便后期对es的index进行统一管理。
filebeat.inputs:
- type: log
# Change to true to enable this input configuration.
enabled: true
paths:
- /var/log/*
output.kafka:
hosts: ["192.168.222.211:9092","192.168.222.212:9092","192.168.222.213:9092"]
topic: topic-demo
required_acks: 1
# 注:
hosts: ["192.168.222.211:9092","192.168.222.212:9092","192.168.222.213:9092"]:指定kafka节点
# 可通过kafka查看是否生成topic
[root@kafka1 ~]# /opt/kafka_2.12-2.3.0/bin/kafka-topics.sh --list --zookeeper kafka3:2181
__consumer_offsets
system-secure
# 查看topic里的内容
[root@kafka1 ~]# /opt/kafka_2.12-2.3.0/bin/kafka-console-consumer.sh --bootstrap-server kafka2:9092 --topic system-secure --from-beginning
……
input{
kafka{
bootstrap_servers => "192.168.222.211:9092,192.168.222.212:9092,192.168.222.213:9092"
topics => "system-secure"
consumer_threads => 1
decorate_events => true
# codec => "json"
auto_offset_reset => "latest"
}
}
output{
elasticsearch {
hosts=>["192.168.222.214:9200","192.168.222.215:9200","192.168.222.216:9200"]
index => "system-log-%{+YYYY.MM.dd}"
}
stdout{
codec => "rubydebug"
}
}
# 启动filebeat
cd /opt/filebeat-6.3.2-linux-x86_64/
nohup ./filebeat -e -c filebeat.yml &
# -e会详细输入传输的日志,如果日志量很大就不要加此参数
# 停止filebeat
ps -elf|grep filebeat
kill -9 pid
tailf /opt/filebeat-6.3.2-linux-x86_64/nohup.out
# 可以看到和kafka建立连接
# 正常情况下会每30s更新一条日志记录INFO [monitoring]
2019-09-07T22:18:39.250+0800 INFO kafka/log.go:36 kafka message: Successfully initialized new client
2019-09-07T22:18:39.255+0800 INFO kafka/log.go:36 producer/broker/0 starting up
2019-09-07T22:18:39.255+0800 INFO kafka/log.go:36 producer/broker/0 state change to [open] on topic-demo/0
2019-09-07T22:18:39.268+0800 INFO kafka/log.go:36 Connected to broker at 192.168.222.211:9092 (registered as #0)
2019-09-07T22:18:39.335+0800 INFO kafka/log.go:36 producer/broker/0 maximum request accumulated, waiting for space
2019-09-07T22:18:39.380+0800 INFO kafka/log.go:36 producer/broker/0 maximum request accumulated, waiting for space
2019-09-07T22:18:39.758+0800 INFO kafka/log.go:36 producer/broker/0 maximum request accumulated, waiting for space
2019-09-07T22:19:09.188+0800 INFO [monitoring] log/log.go:124 Non-zero metrics in the last 30s {"monitoring": {"metrics": {"beat":{"cpu":{"system":{"ticks":120,"time":{"ms":125}},"total":{"ticks":2080,"time":{"ms":2093},"value":2080},"user":{"ticks":1960,"time":{"ms":1968}}},"info":{"ephemeral_id":"369117a9-f4ec-482c-af8b-153eadc6236d","uptime":{"ms":30015}},"memstats":{"gc_next":12647968,"memory_alloc":6865424,"memory_total":225985464,"rss":41283584}},"filebeat":{"events":{"added":34207,"done":34207},"harvester":{"open_files":42,"running":42,"started":42}},"libbeat":{"config":{"module":{"running":0}},"output":{"events":{"acked":34153,"batches":17,"total":34153},"type":"kafka"},"outputs":{"kafka":{"bytes_read":3194,"bytes_write":1116805}},"pipeline":{"clients":1,"events":{"active":0,"filtered":54,"published":34153,"retry":2048,"total":34207},"queue":{"acked":34153}}},"registrar":{"states":{"current":42,"update":34207},"writes":{"success":23,"total":23}},"system":{"cpu":{"cores":2},"load":{"1":0.02,"15":0.05,"5":0.02,"norm":{"1":0.01,"15":0.025,"5":0.01}}}}}}
vi /etc/rc.local
# 在末尾加入以下信息
# elasticsearch
su - elk -c "/opt/elasticsearch-6.3.2/bin/elasticsearch -d"
# kibana
cd /opt/kibana-6.3.2-linux-x86_64/bin
./kibana &
#logstash
cd /opt/logstash-6.3.2/
nohup bin/logstash -f config/haproxy.conf &
# 配置elasticsearch的systemd脚本
vi /usr/lib/systemd/system/elasticsearchd.service
[Unit]
Description=The Elasticsearch Server
[Service]
Type=forking
User=elk
PIDFile=/data/es/elasticsearch.pid
LimitNOFILE=65536
EnvirOnment="JAVA_HOME=/usr/local/java/jdk1.8.0_131/"
ExecStart=/opt/elasticsearch-6.3.2/bin/elasticsearch -d -p /data/es/elasticsearch.pid
Restart=on-failure
[Install]
WantedBy=multi-user.target
# 手动停止elasticsearch,然后使用systemd启动
systemctl start elasticsearchd.service
systemctl enable elasticsearchd.service
# 配置kibana的systemd脚本
vi /usr/lib/systemd/system/kibanad.service
[Unit]
Description=The Kibana Server
[Service]
Type=simple
User=elk
EnvirOnment="JAVA_HOME=/usr/local/java/jdk1.8.0_131/"
ExecStart=/opt/kibana-6.3.2-linux-x86_64/bin/kibana
ExecStop=/bin/kill -9 ${MAINPID}
Restart=on-failure
[Install]
WantedBy=multi-user.target
# 手动停止kibana,然后使用systemd启动
systemctl start kibanad.service
systemctl enable kibanad.service
# 配置logstash的systemd脚本
vi /usr/lib/systemd/system/logstashd.service
[Unit]
Description=The Logstash Server
[Service]
Type=simple
EnvirOnment="JAVA_HOME=/usr/local/java/jdk1.8.0_131/"
ExecStart=/opt/logstash-6.3.2/bin/logstash -f /opt/logstash-6.3.2/config/haproxy.conf
ExecStop=/bin/kill -9 ${MAINPID}
Restart=on-failure
[Install]
WantedBy=multi-user.target
# 手动停止logstash,然后使用systemd启动
systemctl start logstashd.service
systemctl enable logstashd.service
# 配置filebeat的systemd脚本
vi /usr/lib/systemd/system/filebeatd.service
[Unit]
Description=The Filebeat Server
[Service]
Type=sample
ExecStart=/opt/filebeat-6.3.2-linux-x86_64/filebeat -e -c /opt/filebeat-6.3.2-linux-x86_64/filebeat.yml
ExecStop=/bin/kill -9 ${MAINPID}
Restart=on-failure
[Install]
WantedBy=multi-user.target
# 手动停止filebeat,然后使用systemd启动
systemctl start filebeatd.service
systemctl enable filebeatd.service


 京公网安备 11010802041100号 | 京ICP备19059560号-4 | PHP1.CN 第一PHP社区 版权所有